Cloud computing provides on-demand delivery of services like storage, servers, databases, and networking over the Internet. With benefits like scalability, cost savings, easy collaboration, and broad accessibility, more organizations are integrating cloud computing into their operations, especially leveraging the public cloud. However, simply implementing it won’t guarantee optimal performance.
A reliable cloud monitoring tool is necessary to ensure performance, security, and cost efficiency in cloud environments. Monitoring your cloud infrastructure helps identify performance bottlenecks, detect security threats, and provide insights into resource usage, enabling you to optimize costs and maintain a secure, efficient cloud environment.
Geekflare has researched and compiled a list of the best cloud monitoring tools based on key features such as real-time monitoring, scalability, alerting, integration capabilities, custom dashboards, data retention and reporting, and cost efficiency.
- 1. New Relic – AI-Powered Observability Platform
- 2. AWS CloudWatch – Best for AWS Resource Monitoring
- 3. Dotcom-Monitor – Suitable To Monitor Small Internet Infrastructure
- 4. Azure Monitor – Best for Cloud Management Service
- 5. Datadog – Unified Cloud Monitoring for Medium to Large Businesses
- 6. AppDynamics – Suitable for Enterprise
- 7. Prometheus + Grafana – Open-source Monitoring Solution
- 8. Dynatrace – All-in-one Monitoring Solution
- 9. Splunk Observability Cloud – AI-Powered Security and Observability
- 10. Elastic Stack – Best for Centralized Logging
- 11. SigNoz – Open-source APM, Traces, and Metrics Monitoring
- 12. Middleware – All-in-one Monitoring, Data Ingestion for SMBs
- Show moreShow less
You can trust Geekflare
At Geekflare, trust and transparency are paramount. Our team of experts, with over 185 years of combined experience in business and technology, tests and reviews software, ensuring our ratings and awards are unbiased and reliable. Learn how we test.
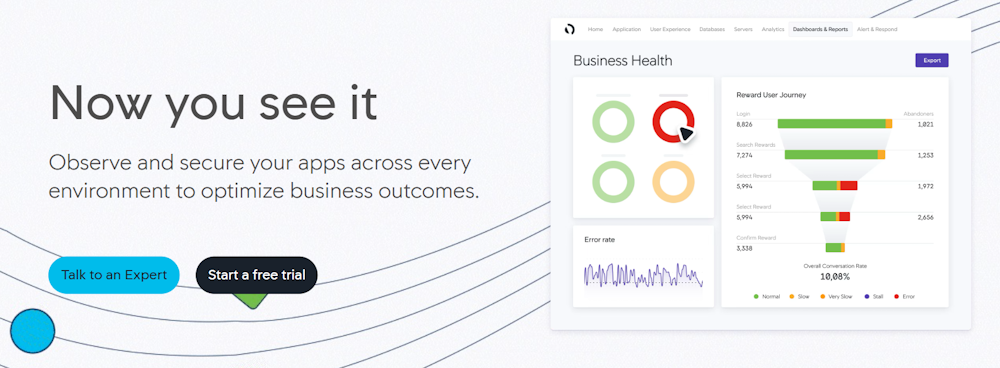
New Relic
New Relic offers a powerful application performance monitoring (APM) and AI-powered observability platform for monitoring cloud and on-premises infrastructure. It lets you check the status of all hosts, applications, events, and alerts, providing a complete picture of overall system health.
The best thing about New Relic is that a single subscription plan lets you do both APM and infrastructure monitoring. In your app performance monitoring, you can monitor CPU and memory for hosts, containers, and virtual machines (VMs), helping you quickly spot deprovisioned resources.
With New Relic, you can easily map out connections and interactions between different infrastructure components and applications. As a result, it becomes easier to identify the root cause of performance or security issues.
New Relic Features
- Map infrastructure and app connections to quickly troubleshoot issues
- Check hosts, events, and alerts for system health
- Assess app deployment effects on hosts using change tracking
- Evaluate software to identify outdated or problematic settings
- Assess app deployment impacts on hosts using embedded change tracking
New Relic Pricing
New Relic follows usage-based pricing that depends on users and data. You need to contact New Relic for the final pricing based on your requirements. It offers a free-forever plan for one user with a 100 GB data limit.
AWS CloudWatch
Amazon CloudWatch is a cloud monitoring solution that helps you monitor your applications and resources on Amazon Web Services (AWS), on-premises, or any other cloud.
Amazon CloudWatch lets you gain insights into key metrics and gather and analyze log files. You can set alarms in CloudWatch to monitor system performance. It collects all important data about applications in the cloud, such as uptime, errors, and resource usage, to offer you a unified view of your cloud infrastructure’s operational health.
The CloudWatch dashboard provides actionable insights based on logs and metrics to troubleshoot operational issues. It automates resource management by setting actions when thresholds are met, helping optimize resources. You can define these thresholds or use machine learning models.
Popular use cases for Amazon CloudWatch are monitoring application performance, performing root cause analysis, optimizing resources, and testing website impacts.
CloudWatch Features
- Create reusable graphs to visualize cloud resources and applications in a unified view for easier monitoring.
- Monitor resources across AWS accounts with cross-account observability
- Automate resource management based on thresholds.
- Trigger automated actions with real-time CloudWatch events.
- Diagnose internet issues quickly with an internet monitor.
- Identify anomalies using machine-learning (ML) algorithms.
CloudWatch Pricing
With Amazon CloudWatch, you only pay for what you use, with no upfront fees. Many AWS services, such as EC2, S3, Kinesis, etc., send free metrics to CloudWatch. Many applications can operate within the free tier limits. The free tier includes ten custom metrics, three custom dashboards, ten alarms, and 5 GB of log data per month.
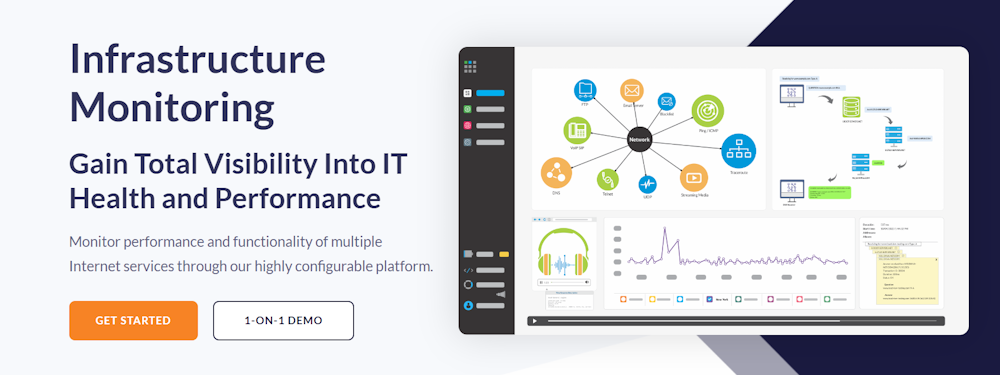
Dotcom-Monitor’s infrastructure monitoring solution offers detailed insights into your IT infrastructure’s uptime, performance, and functionality.
Dotcom-Monitor helps ensure your website runs smoothly by checking the structure of your files and monitoring FTP server availability. It verifies that your email server works correctly and keeps DNS performance uninterrupted, preventing website downtime. You can use these website monitoring tools for detailed website monitoring.
Dotcom-Monitor lets you monitor the response times of your network devices and network health by checking various protocols and ports, such as ICMP Ping, UDP, Traceroute, TCP Port, and Telnet checks.
With Dotcom-Monitor’s private agents, you can track internal web applications and services behind firewalls or externally inaccessible ones. You get a unified dashboard, which offers real-time data, detailed charts, and shareable insights for quick issue detection. You can customize notifications for critical metrics to monitor outages or issues.
Dotcom-Monitor Features
- Guarantee global availability with over 30 monitoring locations across major networks.
- Diagnose downtime with configurable reports and real-time dashboards
- Gain end-to-end visibility into your IT infrastructure’s health
- Do internal cloud network monitoring with private agents, even for devices behind firewalls
- Customize alerts to stay informed on critical metrics in real-time
- Identify performance issues using a unified dashboard with real-time and historical data
Dotcom-Monitor Pricing
Dotcom-Monitor pricing starts at $40 per month. A 30-day free trial is available to assess its features.
Azure Monitor
Azure Monitor helps you gain complete visibility into your applications, networks, and infrastructures. It includes three key services—Azure Monitor, Log Analytics, and Application Insights—to provide comprehensive monitoring, log analysis, and application performance insights. It allows you to monitor Azure, multi-cloud, on-premises, and hybrid environments.
Azure Monitor provides curated visualizations for easy understanding of complex data, distributed tracing to correlate operations and track requests across services, and centralized log viewing for streamlined analysis. These features work together to help you quickly identify and troubleshoot cloud performance issues.
Azure Monitor offers multiple alert options, such as service health alerts, resource health alerts, and more. Service health alerts notify you of outages, disruptions, planned maintenance, and security advisories, helping you stay informed about the status of your cloud environment. Resource health alerts provide near real-time notifications when your resources’ health status changes, allowing you to address issues quickly.
Like Azure, other leading cloud providers also offer monitoring solutions. Examples are DigitalOcean’s infrastructure monitoring and GoogleCloud’s Observability.
Azure Monitor Features
- Get a customized monitoring experience for specific services with minimal configuration.
- View ingested data from your distributed environment on a single pane of glass.
- Troubleshoot, diagnose, and analyze telemetry data in depth.
- Receive near-real-time alerts and autoscale resources when the load increases.
- Leverage built-in visualization tools, such as Azure workbooks, Grafana, and Power BI.
- Benefit from built-in security and compliance features.
Azure Monitor Pricing
Azure Monitor’s billing is mainly determined by the amount of data ingested. Additional charges apply for specific features like alerts, notifications, web tests, and data export. You can try Azure free for the first 30 days.
Datadog
Datadog infrastructure monitoring solution is a powerful cloud monitoring solution that offers metrics, visualizations, and alerts to help you manage your diverse environments. You can deploy it in flexible settings, including on-premises, IoT, multi-cloud, and hybrid.
Datadog infrastructure monitoring allows you to ingest all your metrics and selectively index only those valuable for your queries, making it the best tool for unified cloud monitoring. It lets you correlate metrics, traces, logs, and security signals across different technology stacks. Consequently, you can quickly find and fix issues in your infrastructure.
What’s more, Datadog allows you to check continuous historical records, even on obsolete infrastructure, helping you track performance and usage trends over time for better forecasting and resource planning. It leverages machine learning to highlight issues, which helps reduce team members’ alert fatigue.
Datadog Infrastructure Monitoring Features
- Gain visibility into any stack or application from any scale or location.
- Offers live process monitoring to track the impact of each process running in a stack
- Continuously check configurations across cloud accounts, hosts, and containers to assess and enhance security posture.
- Track and meet audit requirements with built-in support for over 15 compliance frameworks like PCI DSS, SOC 2, and GDPR.
- Automatically detect and prioritize cloud vulnerabilities based on business impact and deep observability context.
- Adapt your monitoring automatically as your infrastructure grows or changes.
- Get alerts only for critical issues, reducing unnecessary notifications.
Datadog Infrastructure Monitoring Pricing
The subscription cost of Datadog infrastructure monitoring starts at $15 per host per month. A free plan with limited features is also available, and the company offers a 14-day free trial of paid plans to evaluate the infrastructure monitoring solution.
AppDynamics
AppDynamics infrastructure monitoring allows you to monitor, grow, and optimize your application environment based on your business demands. It offers unified visibility into your on-premises and cloud infrastructure.
With AppDynamics, you can monitor every infrastructure component, including servers, containers, and networks within the hybrid cloud environments where your business lives. It helps you avoid downtime and improve customer service by linking critical business outcomes and user experiences to events happening in your hybrid environment.
Additionally, AppDynamics enables you to prioritize monitoring of key performance indicators (KPIs) that directly affect critical business factors, such as revenue, allowing for smarter scaling and more informed decision-making. Its purpose-built observability helps you quickly isolate issues in cloud environments, enabling quick fixes.
AppDynamics lets you balance application demand with resource requirements, helping you allocate the right amount of resources to meet performance needs. By aligning resourcing with what’s most important to your business, you can optimize cloud spending, avoid overprovisioning, and maintain application efficiency.
AppDynamics Features
- Visualize all infrastructure components for optimal performance across environments.
- Automatically prioritize tasks across new and legacy environments
- Automate data collection and correlate cloud services with business metrics
- Isolate performance issues in Kubernetes and containers with tailored observability
- Optimize cloud spending by balancing resource needs with the priorities of your business operations
AppDynamics Pricing
AppDynamics pricing starts at $6 per month for each CPU core, with the total cost billed annually. A free trial is available.
Prometheus + Grafana
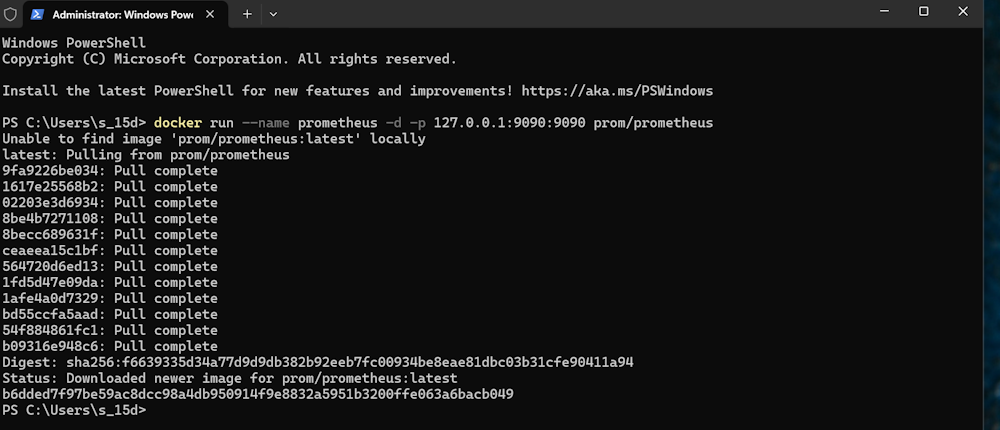
Prometheus is an open-source service monitoring and alerting tool that gathers data from various systems in your infrastructure at different levels to determine its health.
Prometheus collects metric data from software and infrastructure using scraping, which means Prometheus regularly checks specific endpoints for new data. It uses PromQL query language to retrieve and manipulate the metric data stored in Prometheus. You have to use PromQL to filter, aggregate, and analyze time-series data.
Grafana is an open-source platform that helps you query, visualize, and create alerts on your metrics, regardless of where they are stored. It offers various visualizations, such as series graphs, heat maps, and cutting-edge 3D charts. It also offers a paid Grafana Cloud Incident Response & Management (IRM) tool.
By integrating Prometheus and Grafana into your cloud infrastructure, you create a powerful, open-source analysis tool to check its health.
Popular use cases for Prometheus + Grafana could be Kubernetes monitoring, application performance tuning and optimization, alerting and anomaly detection, and cloud cost visualization.
Prometheus + Grafana Features
- Prometheus is 100% open-source, so you will have strong community support
- Grafana’s Alerting page unifies Grafana-managed alerts and Prometheus-compatible alerts in a single, centralized location for easier management
- Easy tracking for Service Level Indicators (SLIs) and Service Level Objectives (SLOs)
- Multiple visualization options in Grafana enable easy data analysis
Prometheus + Grafana Pricing
You can use Prometheus and Grafana tools for free.
Get started with Grafana and Prometheus
Dynatrace
Dynatrace’s AI-powered infrastructure offers end-to-end monitoring and visualization of your dynamic environments, including hosts, virtualization, networks, and services across hybrid and cloud environments.
Dynatrace automatically retains the context of ingested data. Consequently, it offers powerful analytics and explainable AI-driven root cause analysis. You can also integrate with automation platforms and incident remediation tools to automate the remediation process, ticketing workflow, and real-time configuration management database (CMDB) updates.
Dynatrace automation capabilities also allow you to provision your infrastructure resources to offer a stellar customer experience and optimize cost.
Dynatrace’s Davis AI problem cards help reduce Mean Time to Identify (MTTI) and Mean Time to Repair (MTTR). They automatically correlate traces, events, metrics, and logs from different tools and data silos. This eliminates the need for manual analysis and speeds up issue resolution.
Dynatrace Features
- Provide unified observability for cloud environments, containers, networks, and data center technologies with hosts of any size.
- Include Infrastructure Monitoring, AIOps, and Digital Business Analytics.
- Offer unlimited monitoring of containers and network processes.
- Automate remediation, ticketing, and updates through seamless integrations with automation platforms.
- Deliver unlimited AI-assisted root cause analysis.
- Customize to fit your unique environment by using APIs, hundreds of ready-made extensions from the Dynatrace Hub, and custom apps.
Dynatrace Pricing
Dynatrace infrastructure pricing starts at $0.04 per hour for any size host. A free 15-day free trial is available to explore its features.
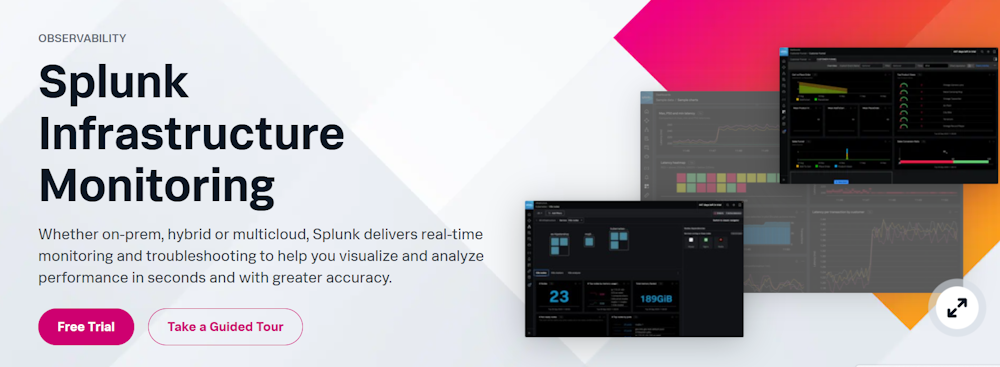
Splunk Observability Cloud
Splunk Observability Cloud offers multiple monitoring solutions in one tool, including full-context infrastructure monitoring, cloud-native application performance monitoring, real-user monitoring, and synthetic monitoring.
In one interface, Splunk allows you to visualize real-time metrics and traces for a specific log event. This gives you more context by showing related performance data alongside the event, which helps you quickly identify patterns, issues, and anomalies.
Splunk provides data in context to help you answer business-critical questions. It allows you to monitor service-level objectives (SLOs) and indicators (SLIs). You can also add log-based charts to custom dashboards, enhancing metrics-based monitoring by visualizing important data. With these charts, you can quickly perform root cause analysis.
Splunk automatically finds Kubernetes objects and shows their health and performance instantly. You can view this in customizable dashboards and charts.
Splunk Observability Cloud Features
- OpenTelemetry-native platform for deep visibility across on-prem, hybrid, and multi-cloud environments
- Analyze 100% of your data to eliminate blind spots
- AI/ML-driven features like Service Maps and Trace Analytics for faster issue resolution
- Troubleshoot based on business impact by integrating workflows and tags with telemetry data
- Link petabyte-scale log analytics with real-time metrics and traces automatically for faster, more accurate root cause identification
Splunk Observability Cloud Pricing
Splunk Observability Cloud pricing starts at $15 per host per month, with annual billing. It offers a 14-day free trial.
Try Splunk Observability Cloud
Elastic Stack
Elastic Stack is a suite of tools, including Elasticsearch, Kibana, Beats, Logstash, and more. It can collect data from any source in any format and then analyze and visualize it to offer valuable insights into your applications’ performance and security.
Elastic Stack allows you to ingest metrics, traces, logs, events, and content from your applications and infrastructures using Elastic Agent, data connectors, web crawlers, API, and more. It also offers native integrations with Microsoft Azure, AWS, and Google Cloud to send data to Elastic Cloud.
Kibana in Elastic Stack lets you dive into detailed insights to monitor systems, investigate threats, analyze search performance, and initiate actions. Its advanced capabilities, such as machine learning, help you reduce the mean time to resolution (MTTR). Moreover, you can leverage Kibana’s ad hoc search to look for signs of discovered exploits.
Elastic Stack’s alerting features notify you automatically about important changes in your cluster, such as cluster state, license expiration, and other key metrics across Kibana, Elasticsearch, and Logstash.

Elastic Stack Features
- Centralized monitoring to track the health and performance of multiple Elastic Stack deployments
- Manage user authorization with role-based access control (RBAC) by assigning roles and privileges.
- Create specialized links to Kibana assets for easy access without credentials.
- Enable auditing to log security events like authentication failures and refused connections.
- Set threshold alerts for Elasticsearch data changes using query-based alerting features.
- Receive notifications via email, webhooks, IBM Resilient, Jira, Microsoft Teams, PagerDuty, ServiceNow, Slack, and xMatters
Elastic Stack Pricing
Elastic Stack pricing starts at $95 per month. A 14-day free trial is available to assess its features.
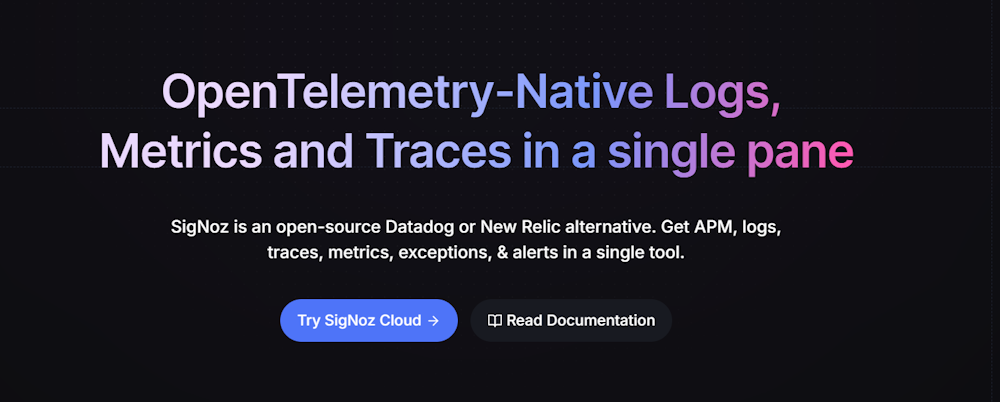
SigNoz
SigNoz is an open-source observability tool that offers multiple functions, such as infrastructure monitoring, application performance monitoring (APM), and log management in a single platform. It is a solid alternative to New Relic, DataDog, and Dynatrace for those who value transparency in open-source software development.
SigNoz employs distributed tracing, allowing you to track user requests across various services. As a result, you can quickly identify performance issues and correlate your traces with logs for quick debugging. It also allows you to capture exceptions automatically.
SigNoz has data centers in various parts of the world, including the US, EU, and Indian regions, to help you comply with the local data privacy regulations. You can use it in two ways: using SigNoz Cloud or hosting it in your infrastructure.
SigNoz Features
- Reduces resource consumption by up to 50% compared to similar monitoring tools.
- Provides support for multi-cloud environments.
- Simplifies setup with the help of an active online community.
- Monitors advanced latency metrics like P90 and P99 latency.
- Offers detailed visualization tools such as flame graphs & Gantt charts for easy root cause analysis
SigNoz Pricing
SigNoz Cloud pricing starts at $199 per month, with additional charges for logs, traces, and metrics based on usage. It includes a 30-day free trial. The SigNoz Community edition is free for self-hosted deployments.
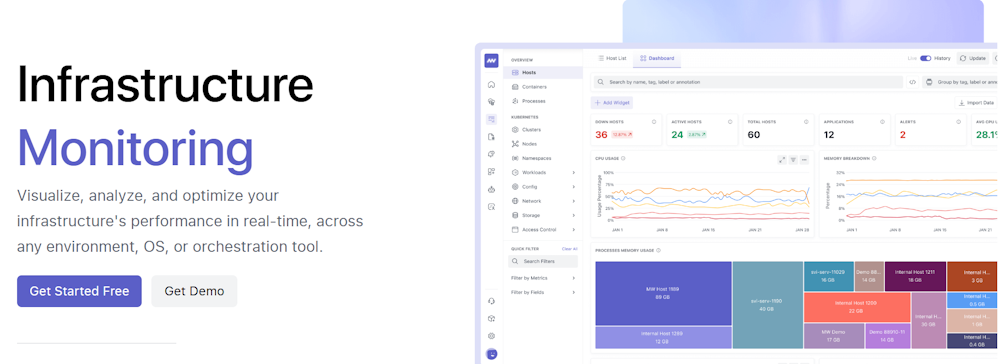
Middleware
Middleware infrastructure monitoring solution helps you improve your infrastructure’s performance by analyzing it and offering insights into performance bottlenecks. It can work in any environment, operating system, or orchestration tool.
With Middleware, you can monitor and visualize all the hosts in your infrastructure with crucial metrics, such as CPU usage, resource status, and memory consumption. Moreover, it lets you easily monitor thousands of infrastructure metrics with real-time monitoring and updates of performance metrics.
Middleware lets you correlate metrics, logs, and traces in one click, allowing you to discover and fix issues quickly. It also allows you to analyze historical records for up to six months.
Middleware offers the option to customize data ingestion to reduce overall spending on observability. This feature also helps reduce alerts and fight alert fatigue in your organization.
You will have dashboards for all infrastructure components, such as VMs, containers, On-Prem, and cloud-hosted machines. Its most popular use case is to gain full visibility into your tech stack.
Middleware Features
- Customizable dashboards and alert thresholds
- Metrics tailored to business needs
- Control metric ingestion with tag-based toggling
- Purposeful data collection to reduce costs
- Kubernetes cluster, node, and pod performance monitoring
- Real-time alerts for any infrastructure performance metric
Middleware Pricing
Middleware offers two subscription options: pay-as-you-go and custom. A forever-free plan with limited features and a 100GB monthly data limit is available. The pay-as-you-go plan includes 100GB of free data. After that, metrics pricing starts at $0.3 per GB.
What Is Cloud Monitoring?
Cloud monitoring is the practice of tracking, analyzing, and managing cloud-based services and applications. Its main objectives are to optimize performance, ensure availability, and secure your cloud infrastructure. Modern cloud monitoring tools can effectively monitor cloud, on-premises, and hybrid environments.
Here are three main categories of cloud monitoring:
- Performance monitoring: It tracks system performance and detects bottlenecks.
- Cost monitoring: It helps identify overuse, underutilization, or unnecessary resources to optimize costs.
- Security monitoring: It identifies and helps you respond to security threats and vulnerabilities.
What Are the Benefits of Using Cloud Monitoring Software?
Cloud monitoring software enhances operational efficiency, optimizes costs, and improves security for businesses using cloud-based infrastructure. Here are the key benefits of using cloud monitoring software:
- Full-stack monitoring: They monitor all components of your cloud infrastructure, including services, applications, containers, resources, and more.
- Real-time alerting: Cloud monitoring tools send real-time alerts to alert you of performance bottlenecks, security issues, or anomalies. By taking corrective actions promptly, you can reduce costs associated with outages, performance issues, and resource overuse.
- Infrastructure analytics: These tools offer detailed analytics on cloud infrastructure usage. They provide a comprehensive view of all hosts in your infrastructure, tracking key metrics like CPU usage, memory utilization, and resource status with real-time updates.
- Optimization opportunities: Cloud monitoring tools create optimization opportunities by analyzing resource usage, identifying inefficiencies, and offering improvement recommendations.
- Automation: Automation capabilities in cloud monitoring software streamline various processes, such as resource provisioning or incident response. This reduces the manual effort required for managing cloud environments and enhances operational efficiency.
- Cost-effective compared to on-premises approach: Cloud monitoring tools are more cost-effective than on-premises solutions because they eliminate the need for costly hardware, maintenance, and dedicated IT staff. They often operate on a pay-as-you-go model, allowing you to scale resources as needed.
- Discover vulnerabilities: Cloud monitoring tools identify security vulnerabilities by continuously scanning for threats and compliance issues.
- Operational efficiency: Cloud monitoring tools deliver real-time insights into system performance and identify issues before they escalate. So they help improve operational efficiency.
- Scalable: Cloud monitoring tools are highly scalable. As your cloud infrastructure grows, these tools can easily accommodate your expanding monitoring needs.
- Optimized cloud spend: Effective cloud monitoring reduces costs by providing detailed insights into resource utilization and cost allocation.
Yes, you can monitor website performance using cloud monitoring tools.
However, using synthetic monitoring tools and real user monitoring tools is a more cost-effective approach to monitoring your website performance. These tools can offer useful insights to improve website performance, including content delivery network performance, user-behavior metrics, and more.
Cloud monitoring tools are typically used to monitor, analyze, and optimize the performance of entire cloud, on-premises, and hybrid infrastructures. Relying on them solely for website performance can be overkill and expensive.