pwshub.com

Ethereum Nears Key Bearish Triangle Apex: Breakdown To $2,160 Target Looms

Recent trading activities reveal that Ethereum is approaching a crucial point in its trading as it forms a bearish triangle pattern, signaling a potential significant breakout. If the cryptocurrency breaks below the lower boundary of this triangle, it could lead to a sharp decline towards the $2,160 target. 

This article aims to provide readers with a detailed technical analysis of Ethereum’s price action, emphasizing the importance of the bearish triangle pattern that has emerged on the charts. It will also explore how this pattern indicates a potential downward move toward the $2,160 support level.

In the past 24 hours, Ethereum has gone up by 2.11%, reaching around $2,642, with a market capitalization of over $317 billion and a trading volume exceeding $21 billion at the time of writing. ETH’s market cap has increased by 2.32%, while its trading volume has surged by 33.62%

Analyzing Current Price Actions Within The Bearish Triangle

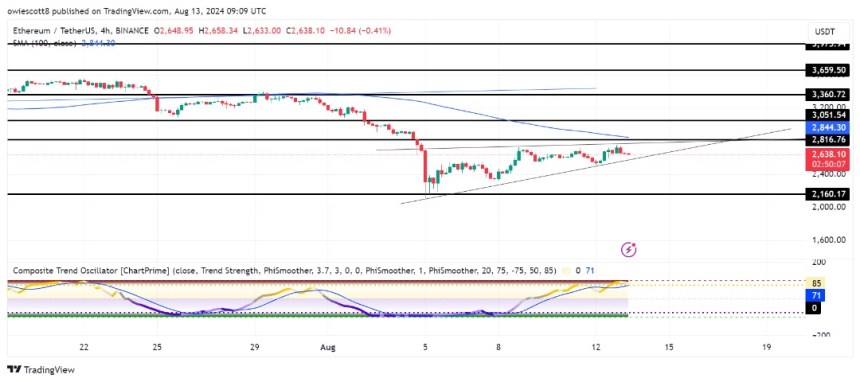
On the 4-hour chart, ETH’s price is currently trading below the 100-day Simple Moving Average (SMA) and is moving closer to the lower boundary of a bearish triangle, with several bearish candlesticks forming. This indicates a prevailing bearish sentiment in the market and suggests the potential for further price declines.
Ethereum
Ethereum trending toward the lower boundary of a bearish triangle | Source: ETHUSDT on Tradingview.com

Additionally, an examination of the 4-hour Composite Trend Oscillator reveals that both the signal line and the SMA line are currently in the overbought zone, with the signal line attempting to cross below the SMA line. This suggests that bearish pressureis building up for the cryptocurrency, potentially resulting in more price declines.

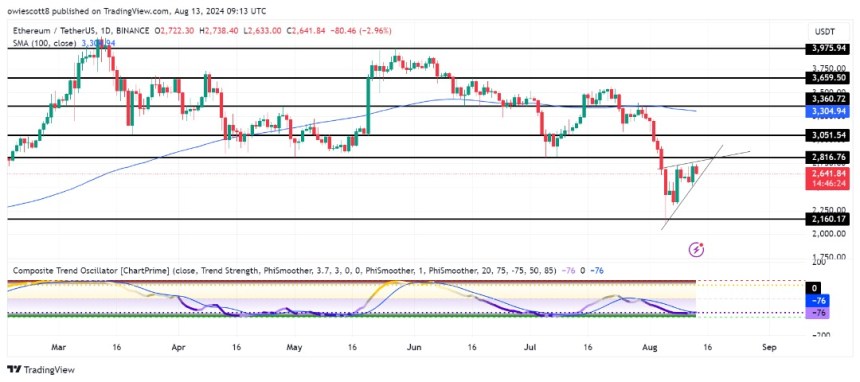
On the 1-day chart, Ethereum remains below the 100-day SMA and, with a single bearish candlestick, is approaching the lower boundary of the bearish triangle. Given the current price action on the daily timeframe, it appears that bearishmomentum is increasing, which could potentially lead to a price breakout.
Ethereum
Ethereum’s bearish strength sparks bearish triangle breakout below | Source: ETHUSDT on Tradingview.com

Finally, the composite trend oscillator on the 1-day chart also suggests a potential for continued bearish movement, with both the signal line and the SMA line in the oversold zone, showing no signs of crossing above.

Potential Scenarios For Ethereum Following A Breakout

If Ethereum’s current trading activities lead to a breakout below the bearish triangle, the price may continue to descend toward the $2,160 support level. When the crypto asset reaches this level and breaks below, it could lead to a further bearish move toward other lower levels.

However, if Ethereum fails to break below, it might start moving toward the upper boundary of the bearish triangle. Should the cryptocurrency break above this upper boundary, ETH could continue to rise to test the $2,816 resistance range and possibly advance to challenge higher levels if the price surpasses this resistance.

Ethereum
ETH trading at $2,623 on the 1D chart | Source: ETHUSDT on Tradingview.com

Featured image from iStock, chart from Tradingview.com

Source: newsbtc.com

Related stories
2 weeks ago - Ethereum is trading near its yearly low of $2,400 after an 18% drop from local highs. ETH has notably underperformed compared to Bitcoin and other altcoins like Solana this cycle, leading to investor concerns. Related Reading: Ethereum...
2 weeks ago - Much like Bitcoin, Ethereum has faced significant challenges in recent months, struggling to sustain any major price rally. After reaching a peak of over $4,000 in March, Ethereum has been consistently declining, failing to break out of...
4 days ago - The world of cryptocurrency offers endless opportunities for investors, but not all tokens are created equal. In 2024, three cryptocurrencies are standing out as the most promising for high returns: Ethereum (ETH), Starknet (STRX), and...
19 hours ago - XRP price is again moving higher above $0.580. The price could gain bullish momentum if it clears the $0.5920 and $0.600 resistance levels. XRP price remained supported near the $0.5700 zone. The price is now trading above $0.580 and the...
1 month ago - Recently, a significant amount of interest—both positive and negative—has been placed on Solana. Experts are highly optimistic about SOL, and crypto analyst Alan Santana once showed his doubt over the token by stating that it might be due...
Other stories
2 minutes ago - Bitcoin's bull pennant suggests a potential surge, with a price target of $158,000 by May 2025 following S&P 500's record high. The post Bitcoin enters ‘bull pennant’ breakout as S&P 500 hits all-time high appeared first on Crypto Briefing.
40 minutes ago - Finance giant BlackRock is saying that Bitcoin (BTC) is a unique investment opportunity offering investors something much different than traditional assets. BlackRock, a firm with over $10 trillion in assets under management, says in a...
1 hour ago - A new XRP price prediction by popular crypto pundit Egrag Crypto projects that the cryptocurrency could experience a historical price surge of about 9,468%. This predicted price gain would push XRP from its current price of $0.58 to $27,...
1 hour ago - Dookey Dash: Unclogged is the new free-to-play version of last year's NFT-gated game, with a $1 million competition for top players.
2 hours ago - So far, Bitcoin has seen a mixture of bulls and bears just in the past day alone. Although bulls appear to be taking the lead given its current market performance, will this be sustainable? Before the US Federal Reserve announcement of...