The truth about application development is that most of the time is spent debugging and fixing errors. So, it is important to invest more in debugging resources to boost error-fixing efficiency. Luckily, the recent Angular 18 release comes with handy debugging tools like hydration error visualization that help you track and analyze bugs.

Debugging is an investigative process that requires critical thinking, and valuable metrics and progress indicators to find the root cause of a hydration issue. Many causes can lead to rendering mismatches between the client side and server side that trigger hydration failure. In this article, you will learn how the new Angular 18 hydration visualization feature boosts the debugging process.
Prerequisites
This tutorial requires you to have installed Node.js and a project using Angular 18. We will also use the Angular DevTools browser extension, which is available in Microsoft Edge, Mozilla Firefox, and Google Chrome. If you are not using these browsers, check if your browser has the DevTools extension; you can do so by searching for DevTools in your browser’s extension store.
What is hydration visualization?
In Angular development, hydration is the process of converting pre-rendered HTML from the server into a fully interactive client-side application. Angular 18 gives you the status of the hydration process, and errors are displayed on the components pane in DevTools.
Enabling your web application to hydrate its contents is very simple. But the tough part is knowing which part was successfully hydrated. In previous Angular versions, this is how you would know your components were all hydrated:

The problem arises when there are components that fail to hydrate. How do you know which specific components failed and get a detailed message about them?
With Angular 18, your application’s components get tagged with a hydration status as shown below:
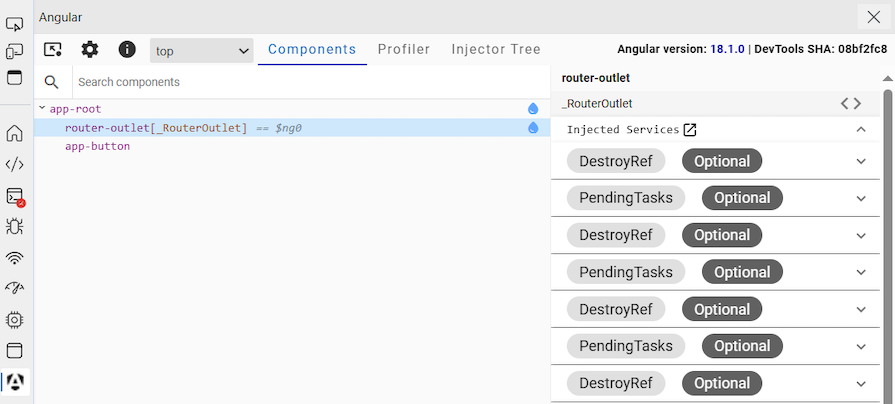
The blue water drop indicates that the component was successfully hydrated. The app root components were hydrated, excluding the appbutton component, which shows that hydration was not enabled. We will explore more of these hydration statuses in the next section of this article.
Below are the benefits of hydration error visualization in Angular:
- Improved error tracking: The hydration status indicators make it easy to identify components that need to be fixed to ensure that the user experiences a smooth UI transition. Precise tracking helps with understanding the context of errors, facilitating more accurate and effective fixes
- Faster issue detection and error resolution: Early detection and elimination of hydration errors prevent bugs from being embedded in the codebase. Technical debt will accumulate if errors are not resolved on time. Once the application has technical debt, it is very difficult to maintain the application codebase or even redesign it
- Better understanding of application flow: With better error analysis, developers can make informed decisions about code organization and architecture to improve code quality. This helps maintain consistency between the server and client side because content will appear correctly and interact seamlessly across different environments
A framework like Angular can experience hydration errors that are mostly caused by contradictions between server-rendered HTML and client-side-rendered HTML contents. Below are some of the reasons hydration fails:
- Mismatching rendering: APIs and components have to be available on both the server side and client side to ensure there are no inconsistent rendering issues. Using APIs such as
$windowwill cause issues because they are not available on the server. Also, using theDate.now()function will produce different outputs on the server side and client side, leading to a rendering mismatch - Third-party component issues: Using different versions of third-party libraries and components on the server side and client side can cause many issues. Components have to be initialized for client-side and server-side differences. Discrepancies in library versions can lead to problems like inconsistent behavior, rendering errors, and hydration mismatches. Additionally, third-party components often need to be initialized differently depending on whether they are being rendered on the server or client
- Localization issues: The server side should be localized synchronously with the client side to avoid locale issues. This synchronization ensures that the locale settings, such as language and regional formats, are consistent between the server and the client. If there is a mismatch in localization between the server-rendered HTML and the client-side Angular application, it can lead to hydration issues
Angular 18 visualizes hydration by fully providing real-time insights into how the server-side rendered application is made available on the client side. In this section, you will learn how to monitor the hydration process of an Angular website. Before you start the visualization process, make sure that hydration is enabled in your Angular project.
If you have not yet enabled hydration for your project, use the following command to enable it:
ng add @angular/ssr
You can also enable hydration manually during the application bootstrapping process using the provideClientHydration() function:
bootstrapApplication(AppComponent, {
 providers: [provideClientHydration()]
});
If you are new to hydration, you can learn more about hydration basics from the Angular documentation.
At the time of writing, Angular hydration visualization is only available on the Angular DevTools browser extension. Use the following link to download the Chrome and Microsoft Edge extension.
After installing the DevTools extension, serve your application and make sure you have configured it for development mode. Serving your application in production mode will trigger Angular DevTools not to display any metrics or debugging tools specific to Angular.
To access the Angular DevTools, press Ctrl + Shift + I. On the developer tools, look for the Angular tab on the left pane. Click it to start using DevTools. If you look in the bottom right corner, you will see the Show hydration overlays switch button. This navigation may differ across different browsers — in this tutorial, I used Microsoft Edge developer tools:
Hydration process status
Hydration offers three statuses: hydrated, not hydrated, and error.
Not hydrated status
If a component is shown in the components section of DevTools and does not have the blue water drop, it means it has not been hydrated. There are several reasons why this may occur: your project has not enabled hydration, or you have manually skipped hydration for a specific component using {ngSkipHydration: 'true'}.
Below is an example that shows the app-button component skipping hydration:
@Component({
  selector: 'app-button',
  standalone: true,
  imports: [CommonModule],
  host: {ngSkipHydration: 'true'},
  templateUrl: './button.component.html',
  styleUrls: ['./button.component.css']
})
The image below shows that other components were hydrated but the app-button did not hydrate because it did not enable hydration:

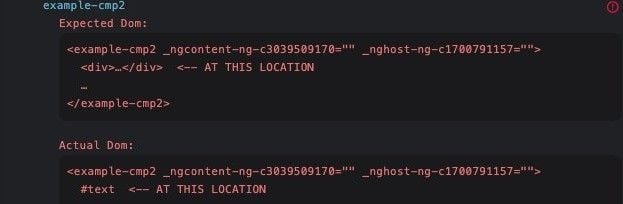
Hydration error status
Of all the hydration statuses, this is the most helpful when it comes to debugging. The red circle with an exclamation mark at the top right corner indicates that the component has mismatch issues. This error suggests that the server-side rendering expected an <example-cmp2> component containing a <div> element at a certain location in the DOM:
Hydration overlay button
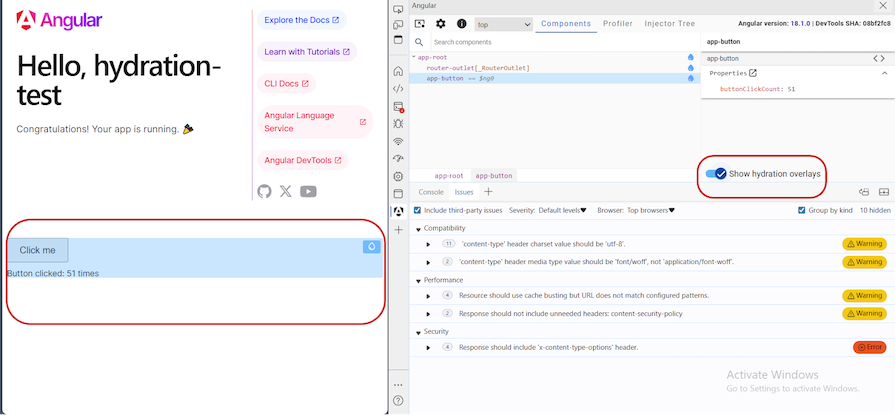
Next is the hydration overlay button. This button simply highlights child components on the user interface with a blue color and the hydration button. This feature makes it easy to see which UI aspects have been hydrated or failed. The hydration overlay button will not appear if your application did not enable hydration.
It is easy to notice that a certain button or UI layout is failing with the blue highlight. The image below shows the Click me button highlighted in blue, indicating successful hydration. The hydration overlay button is on the right and marked with a red box:
Conclusion
Hydration error visualization has boosted application debugging during development. Developers get a hydration status without having to write or execute code. This simplicity helps developers to resolve issues faster and focus on more important tasks such as testing application code to ensure it is ready for deployment.
The hydration visualization feature was developed by Mathieu Riegler, an Angular open source contributor. Mathieu noticed how a lack of hydration error visualization creates a gateway for hydration errors to pop up during production.
Hydration is one of those features that are overlooked until components fail to hydrate. Component hydration failure is detrimental to the look of your application’s user interface. If all components don’t hydrate, there will be missing or distorted website contents, such as incomplete forms or unresponsive buttons.
Fortunately, this article has equipped you with the knowledge of what new hydration visualization statuses mean in Angular, especially how the hydration overlay button identifies UI components that are fully hydrated and those that are not. This easy identification makes it easy to manage and address issues that affect the users.
Would you be interested in joining LogRocket's developer community?
Join LogRocket’s Content Advisory Board. You’ll help inform the type of content we create and get access to exclusive meetups, social accreditation, and swag.