Leaflet is a free, open source mapping library for creating responsive maps. It has all the features you need to create interactive mobile-friendly maps for the web.

Thanks to its simple and well-documented API, you can easily get up and running, irrespective of your skill level. Leaflet is also data provider agnostic. You can source map tiles from third-party providers such as OpenStreetMap.
In this article, we’ll explore the many features and benefits that make Leaflet a great choice if you’re working on a project that requires interactive, aesthetically pleasing maps. We’ll also compare it to other popular mapping libraries to help inform your decision.
Introduction to Leaflet
Leaflet is a free, open source JavaScript library for creating interactive and responsive maps for the web. It was created by Vladimir Agafonkin and was first released in 2011.
This lightweight, feature-rich, BSD 2-clause licensed library that supports all the features a map will almost always need. It has built-in support for panning, zooming, markers, popups and tooltips. If the feature you need is not built into Leaflet, most likely, there is a third-party plugin for it.
With Leaflet, you can create a map with all the mapping features you need in a few lines of code:
const map = L.map("map").setView([50.5, 7.5], 13);
L.tileLayer("https://tile.openstreetmap.org/{z}/{x}/{y}.png", {
maxZoom: 19,
attribution:
'© <a href="http://www.openstreetmap.org/copyright">OpenStreetMap</a>',
}).addTo(map);
You can access its source code via the CDN or use one of the available third-party packages if you want to integrate Leaflet with frontend frameworks such as React or Vue.
Be aware that Leaflet is just a JavaScript library. You still need to get the map tiles from third-party tile providers like OpenStreetMap.
Why use Leaflet?
When choosing a framework or library, project requirements such as the application type (web, mobile, desktop), the skills and experience of the development team, and the project’s scale and complexity take center stage.
However, there are additional considerations when choosing a particular framework or library. In this section, we will explore some of them and use them to highlight why you should or should not use Leaflet.
Popularity, community and ecosystem
A vibrant community is vital for the development, success, and sustainability of an open source software project. It fosters rapid project development, knowledge sharing, and user support.
Leaflet has a vibrant community of developers and users. Though created by an individual, its current development and maintenance is mainly driven by a community of users and developers. Such an active community inspires confidence in Leaflet’s future and sustainability.
Pricing and licensing
You need to consider the pricing and license requirements of a package when choosing an open source project. The license specifies the terms and conditions under which you use, modify, and distribute the source code.
Leaflet is a BSD-2 clause licensed project. It’s free to use, and the BSD-2 clause license gives you the liberty to use, modify, and re-distribute the source code.
Documentation
Good documentation makes it easy to pick up a project. As a result, improving development experience. Therefore, before choosing an open source project, consider the availability and quality of its documentation.
Leaflet has a comprehensive and easy-to-understand documentation. Its core API and plugins are well documented too, making it very easy to pick up and start using right away.
Ease of use and learning curve
Before choosing a package, you need to evaluate its ease of use and learning curve. A package that is difficult to pick up can negatively impact developer experience and hinder development speed.
As explained above, Leaflet focuses on the core mapping features that you will almost always use in a map. Therefore, it has a minimal API with gentle learning curve. You will pick it up almost instantly no matter your skill level.
More great articles from LogRocket:
- Don't miss a moment with The Replay, a curated newsletter from LogRocket
- Learn how LogRocket's Galileo cuts through the noise to proactively resolve issues in your app
- Use React's useEffect to optimize your application's performance
- Switch between multiple versions of Node
- Discover how to use the React children prop with TypeScript
- Explore creating a custom mouse cursor with CSS
- Advisory boards aren’t just for executives. Join LogRocket’s Content Advisory Board. You’ll help inform the type of content we create and get access to exclusive meetups, social accreditation, and swag.
Security
Leaflet has been widely adopted and is currently under active development. Therefore, you can be sure of regular updates and security patches. The wide adoption and vibrant community should give you confidence about the security of Leaflet.
Though Leaflet’s source code may be secure, you need to be aware that the map tiles you use with Leaflet are mainly from third-party providers like OpenStreetMap. Ensure that your third-party tile provider has taken the appropriate security measures to avoid exposing your application to security vulnerabilities.
If you’re using a third-party Leaflet plugin, you should also ensure that it’s secure and up-to-date.
Bundle size and performance
One of the benefits of Leaflet is that its bundle size is a scant 42 KB in gzipped form. This is a small bundle size compared to all the features and benefits it delivers. It also offers several internal performance optimizations.
However, you are likely to encounter a performance downgrade if you display several markers on a map.
Integration
Before picking a particular library, you need to evaluate how easy it is to integrate with the already existing tools, frameworks and libraries.
You can easily integrate Leaflet with popular front-end frameworks such as React, Angular, and Vue either directly or using third-party packages.
Further reading:
- React Leaflet Tutorial
- Building an interactive map with Vue and Leaflet
Browser support
There are several desktop and mobile browsers. When choosing a library for a web application, you need to consider browser support. Leaflet is supported in all the modern web browsers.
Getting started with Leaflet
Getting started with Leaflet is easy. You can access it via a CDN or use third-party integrations for frontend frameworks like React. Follow the steps below to start using Leaflet in vanilla JavaScript via a CDN.
Add Leaflet CSS styles to your HTML
You can start by adding the Leaflet CSS styles to your HTML’s head element like so:
<link
  rel="stylesheet"
  href="https://unpkg.com/[email protected]/dist/leaflet.css"
  integrity="sha256-p4NxAoJBhIIN+hmNHrzRCf9tD/miZyoHS5obTRR9BMY="
  crossorigin=""
/>
Add Leaflet JavaScript code to your HTML
After adding the Leaflet styles as described in the previous subsection, add the script tag below to your HTML’s head element:
<script
  src="https://unpkg.com/[email protected]/dist/leaflet.js"
  integrity="sha256-20nQCchB9co0qIjJZRGuk2/Z9VM+kNiyxNV1lvTlZBo="
  crossorigin=""
></script>
Create a container for your map
You can now create an HTML div container for your map and add it to the document’s body element:
<div id="map" class="map"></div>
You need to assign the map container a fixed height either using inline styles or an external stylesheet:
.map {
  height: 500px;
}
That is all you need to start using Leaflet. Leaflet will be added to the window object.You can access it via the variable L. We will now create a basic Leaflet map in the following sub-sections.
Create a Leaflet map
After adding links to the necessary files and creating a container for the map as described above, you can now create a Leaflet map. Add the code below at the end of the body element (just before the closing </body> tag) using a script tag:
const map = L.map("map").setView([50.5, 7.5], 13);
L.tileLayer("https://tile.openstreetmap.org/{z}/{x}/{y}.png", {
maxZoom: 19,
attribution:
'© <a href="http://www.openstreetmap.org/copyright">OpenStreetMap</a>',
}).addTo(map);
The code above will initialize the map and set its center in central Europe. It also sets the initial zoom level to 13. You can change them to your preferred values. The map will look like the image below:
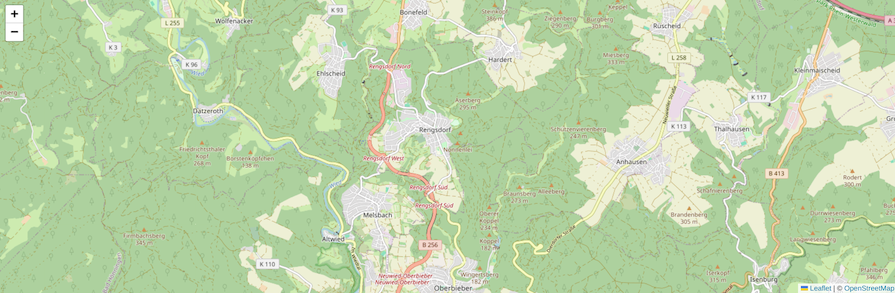
The above example loads the tile layers from OpenStreetMap. Leaflet is agnostic regarding the map data provider. If you’d prefer, you can use tiles from other providers.
Similarly, we used the unpkg CDN in the example above. Several other popular CDNs like cdnjs.com and jsdelvir.com also host Leaflet. You can use them instead of unpkg.
Key Leaflet features to know
To remain lightweight, Leaflet focuses on the core mapping features you will almost always need. In addition to the built-in features, Leaflet has an extensive collection of plugins within its ecosystem. You can also write your own plugin if the functionality you need is not available in the plugin ecosystem.
Let’s explore some of the main built-in Leaflet features you will most likely use in your project. They are very useful for adding interactivity to your map.
Layers
Layers are the basic building blocks for interactive maps in Leaflet. It includes tiles, popups, markers, circles, and polygons.
As explained above, you can add a tile layer to Leaflet from a third-party tile provider like OpenStreetMap. Leaflet doesn’t have its own map imagery:
const map = L.map("map").setView([50.5, 7.5], 13);
L.tileLayer("https://tile.openstreetmap.org/{z}/{x}/{y}.png", {
maxZoom: 19,
attribution:
'© <a href="http://www.openstreetmap.org/copyright">OpenStreetMap</a>',
}).addTo(map);
Leaflet also has a built-in method for creating a group of tile layers and a control UI to switch between them. We will explore the other Layers in the following sub-sections.
Markers
Markers come in handy if you are looking to draw emphasis to specific locations or features on a map. In Leaflet, you can use the built-in Marker method to draw markers. It takes the geographical coordinates of the marker as first argument and an optional object as second argument:
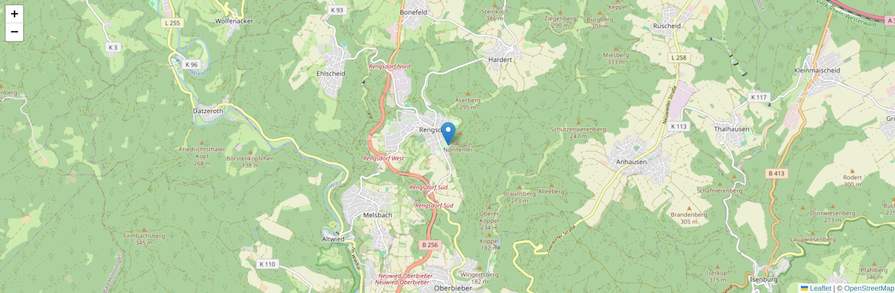
const marker = L.marker([50.5, 7.5]).addTo(map);
The above example will add a marker at the center of the map. The blue pin is the default image if you don’t pass a custom image to the marker function:
You can use your own image to display a custom marker. Use the built-in icon function to create a custom icon and display it using the marker function like so:
const icon = L.icon({
  iconUrl: "icon.svg",
  shadowUrl: "icon-shadow.svg",
  iconSize: [20, 20],
  shadowSize: [20, 20],
});
const marker = L.marker([50.5, 7.5], {
  icon: icon,
}).addTo(map);
The code above will display a custom image at the specified coordinates.
Instead of using images, you can use other shapes such as circles and polygons to draw attention to specific coordinates or features on the map.
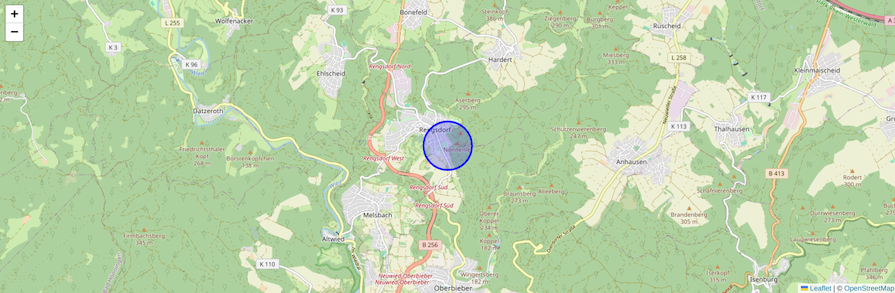
Adding a circle is similar to adding an image marker. However, you need to specify the fill color and the radius of the circle in meters:
const circle = L.circle([50.5, 7.5], {
  color: "blue",
  fillColor: "blue",
  radius: 500,
}).addTo(map);
The code above will add a blue circle of radius 200 meters to our map. The circular marker will look like the image below:
Popups
Popups are useful for attracting user attention, encouraging specific user action and displaying information when a user hovers over or clicks certain features on the map.
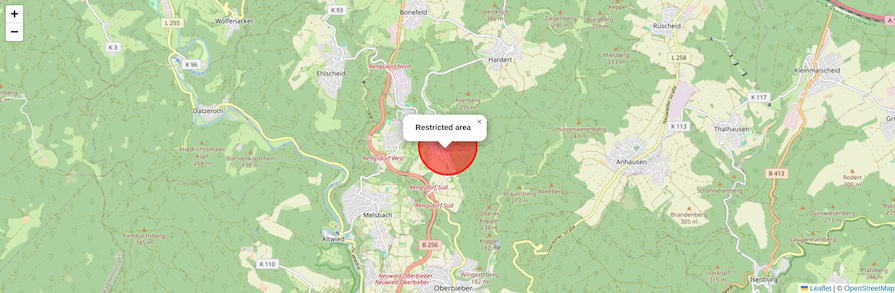
In Leaflet, you can use the bindPopup method to attach popups to objects. The bindPopup method attaches a popup with the specified HTML to a marker:
const restrictedArea = L.circle([50.5, 7.5], {
  color: "red",
  fillColor: "red",
  fillOpacity: 0.5,
  radius: 600,
}).addTo(map);
restrictedArea.bindPopup("<b>Restricted area</b>");
The code above will add a red circular marker illustrating a restricted area. It opens a popup when the marker is clicked. The popup will look like the image below:
By default, Leaflet displays the popup after clicking the marker. However, you can also open the popup using the openPopup function like so:
restrictedArea.bindPopup("<b>Restricted area</b>").openPopup();
Overlays
In Leaflet, overlays are layers that you can place on top of the base layer. You can use them to display visual elements and highlight specific features without replacing the base map.
Leaflet has three built-in overlay APIs:
ImageOverlayVideoOverlaySGVOverlay
After creating a map, you can use the L.ImageOverlay method to load and display a single image within specific bounds of the map:
const imageUrl = "historical-map.png";
const latLngBounds = L.latLngBounds([
  [50.4, 7.4],
  [50.6, 7.6],
]);
const imageOverlay = L.imageOverlay(imageUrl, latLngBounds, {
  opacity: 0.8,
  alt: "This is alt text for the image",
  interactive: true,
}).addTo(map);
As illustrated above, the L.imageOverlay method takes the image URL, the bounds within which to display the image and an optional object as arguments. The code above will load the image within the provided bounds.
Similarly, you can use the L.VideoOverlay function to add video overlay to your base map.
Plugins
As explained above, Leaflet was intentionally designed to be minimal and lightweight. It bundles only the core mapping features you need. However, you can extend its built-in features using plugins.
Leaflet has a whole ecosystem of plugins. Each plugin has its own documentation. For example, the ResetView plugin adds reset view control to your map. You can load it from a CDN and use it like so:
L.control
  .resetView({
    position: "topleft",
    title: "Reset view",
    latlng: L.latLng([51.505, -0.09]),
    zoom: 13,
  })
  .addTo(map);
You can also create your own plugin if those in the ecosystem do not meet your project requirements. The Leaflet documentation has detailed guides on how to create plugins.
Use cases of Leaflet
In this section, we will explore some of the common use cases of Leaflet. There are many, but some popular ones include:
- Visualizing data tied to geographic locations — As explained above, Leaflet has built-in features for creating responsive and interactive maps for the web. You can use it to visualize data tied to geographic locations. For example, visualizing real estate data or changes in historical data over time
- Creating apps that provide location-based services — Leaflet comes in handy for creating applications that offer location-based services such as GPS tracking. You can obtain the GPS coordinates of a user and display the nearest service centers like hospitals, coffee shops, and bank ATMs on a Leaflet map
- Represent real-time data on a map — Information about public transportation, traffic, and weather updates are more useful when they’re made available in real-time. You can use Leaflet to represent such real-time data on a map
Comparing Leaflet with other popular mapping libraries
Leaflet is a popular, open source mapping library. However, it’s by no means the only mapping library in the JavaScript ecosystem. In this section, we will compare Leaflet with OpenLayers, Mapbox GL JS, Google JavaScript API, and ArcGIS API for JavaScript.
Comparing Leaflet and OpenLayers
OpenLayers is a feature-rich, free, open source mapping library for creating interactive maps for the web. It is very similar to Leaflet in many ways:
- Free, open source mapping libraries
- BSD-2 clause licensed
- Highly performant, though you’ll encounter a performance hit when working with thousands of markers in Leaflet
- Well-documented APIs and several online learning resources
- Vibrant communities of developers and users. Their development is currently mainly community-driven
- Require you to load map imagery from third-party data providers like OpenStreetMap
Leaflet is more widely used and has a larger community in comparison to OpenLayers. If that’s an important factor to you — for example, since a larger community could translate to more peer resources and faster answers to your questions — then Leaflet might be the better choice.
Comparing Leaflet and Mapbox GL JS
Mapbox GL JS is a JavaScript mapping library developed by Mapbox. You can use it to create interactive maps in a web application. These libraries share some similarities, but have some important differences as well:
- Unlike Leaflet, the latest version of Mapbox GL JS is proprietary. The use, modification, and distribution of its source code is restricted to the Mapbox Terms Of Service. Therefore, you need the appropriate license to use Mapbox GL JS
- Both Leaflet and Mapbox GL JS have well-documented APIs and are under active maintenance and development. The development and maintenance of Leaflet is mainly community-driven, while the development and maintenance of Mapbox GL JS is driven by Mapbox, the company behind Mapbox GL JS
- Leaflet has a simple mapping API suitable for developing simple maps while Mapbox GL JS is suitable for complex high-performance maps
- Leaflet is DOM-based while Mapbox GL JS is WebGL-based
Understanding these differences might help you determine which library is better suited to your project requirements.
Comparing Leaflet and Google Maps JavaScript API
The Google Maps JavaScript API is another JavaScript package you can use to create interactive maps in your web and mobile application. Though you primarily use Google maps as the base map with the Google maps JavaScript API, it also gives you the flexibility to create maps with custom map imagery.
Here are some important points to consider when comparing the two:
- Leaflet is a free, open source JavaScript library while the Google Maps JavaScript API is proprietary. You need an API key to use the Google Maps JavaScript API, and it might cost you money
- Leaflet offers the core mapping features that you can extend with plugins while the Google Maps JavaScript API comes with an extensive set of features out of the box
- The development and maintenance of Leaflet is mainly community-driven while the Google Maps JavaScript API is developed and maintained by Google
- Both Leaflet and the Google Maps JavaScript API are well-documented with an extensive collection of online learning resources
If you’re willing to pay for the extensive feature set offered by the Google Maps JavaScript API, it could be a more convenient option, especially considering that it’s developed and maintained by Google itself.
However, keep in mind that Leaflet is highly extensible and performant, which allows it to meet most needs without the cost associated with the Google Maps JavaScript API — although its free tier is fairly generous.
Comparing Leaflet and ArcGIS Maps SDK for JavaScript
The ArcGIS Maps SDK for JavaScript is a proprietary software development kit for building interactive maps. It is developed and maintained by Esri. It has built-in features for 2D and 3D visualization. In this sub-section, we will compare Leaflet and ArcGIS map SDK for JavaScript:
- Leaflet is a free, open source mapping library while ArcGIS Map SDK for JavaScript is a proprietary software. You need an API key to use it
- The development and maintenance of Leaflet is community-driven while the ArcGIS Maps SDK for JavaScript is developed and maintained by Esri
- Both libraries have well-documented APIs with extensive collection of online learning resources
- Leaflet is a library for creating 2D maps while the ArcGIS Maps SDK for JavaScript is capable of creating both 2D and 3D maps
If your project specifically requires 3D maps, the ArcGIS Maps SDK for JavaScript is your best bet.
Comparison table: Leaflet vs. other popular mapping libraries
Some of the above comparisons have been summarized in the table below:
| Leaflet | OpenLayers | Mapbox GL JS | Google Maps JavaScript API | ArcGIS Maps SDK for JavaScript | |
|---|---|---|---|---|---|
| License | BSD 2 clause | BSD 2 clause | Mapbox Terms of Service | Google Maps Platform Terms of Service | ArcGIS Maps SDK for JavaScript Terms of Service |
| GitHub stars | 40.7k | 11.2k | 11k | Not available | Not available |
| Open source | Yes | Yes | No | No | No |
| Active maintenance | Yes | Yes | Yes | Yes | Yes |
| Documentation | Good | Good | Good | Good | Good |
| Pricing | Free | Free | Paid service with a generous free tier | Paid service with a generous free tier | Paid service with a generous free tier |
| Community support | Good | Good | Good | Good | Good |
| Ease of use | Easy | Easy | Easy | Easy | Easy |
| npm weekly downloads | 1,028,448 | 205,627 | 953,407 | Not available | Not available |
Further reading:
- React map library comparison
- JavaScript mapping APIs compared
Conclusion
Leaflet is a handy JavaScript library for creating responsive and interactive maps for the web. It was intentionally designed to be minimal. By default, it ships the core mapping features that you will almost always use in your app. Therefore, Leaflet is a lightweight and performant library.
You can extend the built-in features using plugins. It has an extensive collection of plugins in its ecosystem. If the feature you need doesn’t have a third-party plugin, you can also create your own.
Leaflet is just a library. It doesn’t provide mapping data. You need to source map imagery from third party providers like OpenStreetMap. Therefore, be sure your third-party tile provider has taken appropriate measures to avoid compromising your application’s security.