SUI is gearing up for a critical move as bullish momentum builds, setting its sights on the $1.16 resistance level. After a period of consolidation, buyers are showing renewed interest, driving the price higher and sparking hopes of a potential breakout. However, the question remains: can the bulls muster enough strength to overcome this key barrier, or will the $1.16 ceiling hold firm and stall further upside?
This analysis explores whether SUI’s bulls have the momentum to break through the critical $1.16 resistance level. We’ll examine key technicalindicators, market trends, and potential scenarios to determine if SUI can sustain its recent upward movement or if it will face another setback.
Bullish Indicators: Are The Stars Aligning For A Break?
On the 4-hour chart, SUI is showing strong positive momentum as it trades above the 100-day Simple Moving Average (SMA). The printing of multiple bullish candlesticks highlights solid buying interest and favorable market sentiment, indicating that a break above the $1.16 level could be on the horizon.

Additionally, the Relative Strength Index (RSI) on the 4-hour chart has climbed above the 50% mark and is currently at 69%. This upward movement suggests that upbeat momentum is strengthening, indicating that buying pressure is increasing. As the RSI approaches overbought territory, it may signal that a breakout could be imminent, with the potential for the price to push higher if the current trend continues.
Technical analysis on the 1-day chart shows that SUI is also making a bullish move toward the $1.18 resistance level after the short-term pullback, highlighted by the formation of a hammer candlestick. Furthermore, the price is trading above the 100-day SMA, reinforcing the positive market sentiment, with buyers potentially driving the price higher for a potential breakout.
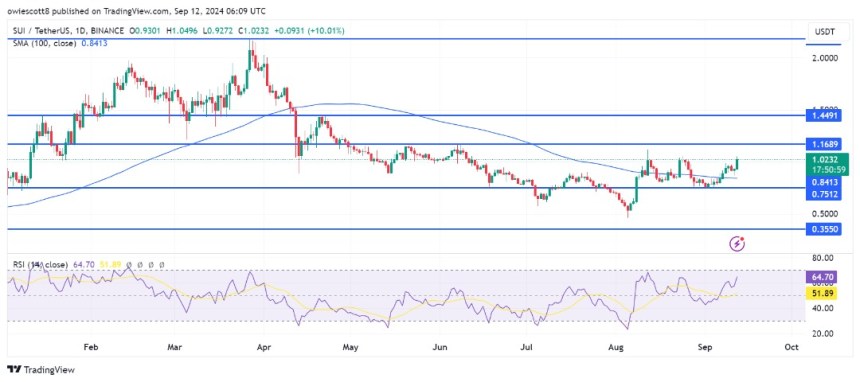
Finally, the RSI signal line on the 1-day chart is trending above the 50% mark, currently at 64%. This suggests that SUI is still experiencing bullish pressure, with the potential for buyers to maintain their dominance and push the price higher.
Critical Levels To Watch: Support And Resistance Zones For SUI
SUI is approaching a key level that could determine its next move. A breakout above the $1.16 resistance level could signal a promising trend and open the path to higher targets, such as $1.44 and its all-time high of $2.18.
If the price is rejected at this level, SUI could find support near $0.8411. Should it fall below this support, the next potential stop might be the $0.3550 level, with further declines possibly leading to the exploration of additional key support zones.
SUI was trading at approximately $1.02 at the time of writing, reflecting a 15.84% increase. The cryptocurrency has a market capitalization of over $2.7 billion and a trading volume of $418 million. Over the past 24 hours, its market cap and trading volume have increased by 15.75% and 55.47%, respectively.
Featured image from LinkedIn, chart from Tradingview.com