Go 1.23 provides a new way for you to help improve the Go toolchain. By enabling telemetry uploading, you can elect to share data about toolchain programs and their usage with the Go team. This data will help Go contributors fix bugs, avoid regressions, and make better decisions.
By default, Go telemetry data is stored only on your local computer. If you enable uploading, a limited subset of your data is published weekly to telemetry.go.dev.
Starting with Go 1.23, you can enable uploading of your local telemetry data with the following command:
go telemetry on
To disable even local telemetry data collection, run the following command:
go telemetry off
The telemetry documentation contains a more detailed description of the implementation.
A brief history of Go telemetry
While software telemetry is not a new idea, the Go team went through many iterations in search of a telemetry implementation that met Go’s requirements for performance, portability, and transparency.
The initial design aimed to be so unobtrusive, open, and privacy-preserving that it would be acceptable to enable by default, but many users raised concerns in a lengthy public discussion, and the design was ultimately changed to require explicit user consent for remote uploading.
The new design was accepted in April 2023, and implemented over that summer.
Telemetry in gopls
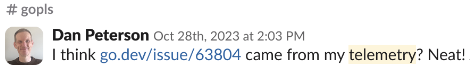
The first iteration of Go telemetry shipped in v0.14 of the Go language server gopls, in October 2023. Following the launch, around 100 users enabled uploading, perhaps motivated by release notes or discussion in the Gophers Slack channel, and data started to trickle in. It wasn’t long before telemetry found its first bug in gopls:
IDE Prompting
While it was great to see telemetry working in practice, and we appreciated the support of those early adopters, 100 participants isn’t enough to measure the types of things we want to measure.
As Russ Cox pointed out in his original blog posts, a drawback of the off-by-default approach for telemetry is the continuous need to encourage participation. It takes outreach to maintain a sample of users that’s big enough for meaningful quantitative data analysis, and representative of the user population. While blog posts and release notes can boost participation (and we’d appreciate it if you would enable telemetry after reading this!), they lead to a skewed sample. For example, we received almost no data for GOOS=windows from early adopters of telemetry in gopls.
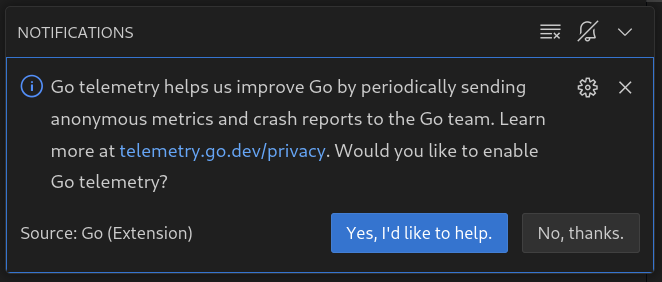
To help reach more users, we introduced a prompt in the VS Code Go plugin asking users if they want to enable telemetry:
As of this blog post, the prompt has rolled out to 5% of VS Code Go users, and the telemetry sample has grown to around 1800 weekly participants:
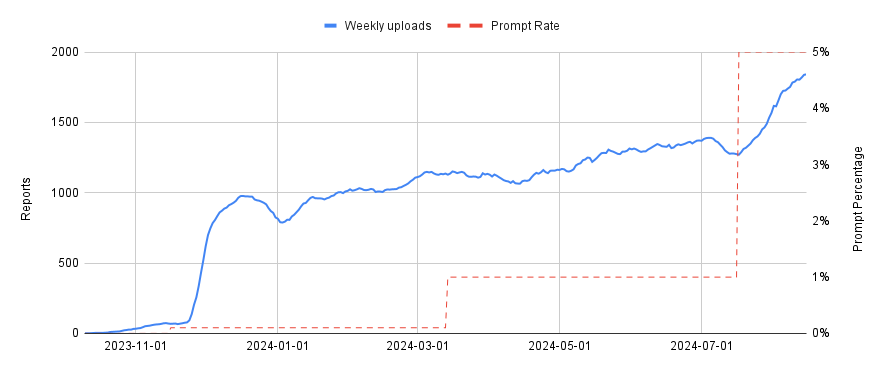
(The initial bump is likely due to prompting all users of the VS Code Go nightly extension).
However, it has introduced a noticeable skew toward VS Code users, as compared to the most recent Go survey results:
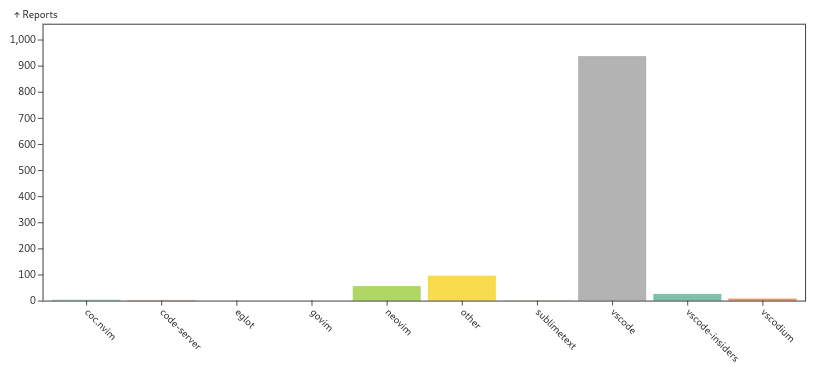
We’re planning to address this skew by prompting all LSP-capable editors that use gopls, using a feature of the language server protocol itself.
Telemetry wins
Out of caution, we proposed the collection of only a few basic metrics for the initial launch of telemetry in gopls. One of those was the gopls/bug stack counter, which records unexpected or “impossible” conditions encountered by gopls. In effect, it’s a kind of assertion, but instead of stopping the program, it records in telemetry that it was reached in some execution, along with the stack.
During our gopls scalability work, we had added many assertions of this kind, but we rarely observed them to fail in tests or in our own usage of gopls. We expected that almost all of these assertions were unreachable.
As we started prompting random users in VS Code to enable telemetry, we saw that many of these conditions were reached in practice, and the context of the stack trace was often sufficient for us to reproduce and fix long-standing bugs. We started collecting these issues under the gopls/telemetry-wins label, to keep track of “wins” facilitated by telemetry.
I’ve come to think of “telemetry wins” with a second meaning: when comparing gopls development with and without telemetry, telemetry wins.

The most surprising aspect of the bugs coming from telemetry was how many of them were real. Sure, some of them were invisible to users, but a good number of them were actual misbehaviors of gopls–things like missing cross references, or subtly inaccurate completion under certain rare conditions. They were exactly the sort of things that a user might be mildly annoyed by but probably wouldn’t bother to report as an issue. Perhaps the user would assume that the behavior was intended. If they did report an issue, they might not be sure how to reproduce the bug, or we’d need a long back-and-forth on the issue tracker to capture a stack trace. Without telemetry, there is no reasonable way that most of these bugs would have been discovered, much less fixed.
And all this was from only a few counters. We’d only instrumented stack traces for the potential bugs we knew about. What about problems we didn’t anticipate?
Automated crash reporting
Go 1.23 includes a new runtime.SetCrashOutput API that can be used to implement automated crash reporting via a watchdog process. Starting with v0.15.0, gopls reports a crash/crash stack counter when it crashes, provided gopls itself is built with Go 1.23.
When we released gopls@v0.15.0, only a handful of users in our sample had built gopls using an unreleased development build of Go 1.23, yet the new crash/crash counter still found two bugs.
Given how useful telemetry has proven with only a tiny amount of instrumentation and a fraction of our target sample, the future looks bright.
Go 1.23 records telemetry within the Go toolchain, including the go command and other tools such as the compiler, linker, and go vet. We’ve added telemetry to vulncheck and the VS Code Go plugin, and we propose to add it to delve as well.
The original telemetry blog series brainstorms many ideas for how telemetry could be used to improve Go. We’re looking forward to exploring those ideas and more.
Within gopls, we plan to use telemetry to improve reliability and inform decision making and prioritization. With the automated crash reporting enabled by Go 1.23, we expect to catch many more crashes in prerelease testing. Going forward, we’ll add more counters to measure the user experience–latency of key operations, frequency of use of various features–so that we can focus our efforts where they will most benefit Go developers.
Go turns 15 this November, and both the language and its ecosystem continue to grow. Telemetry will play a critical role in helping Go contributors move faster and more safely, in the right direction.