
Bitcoin surged to $72,700 on Tuesday following a two-week ceasefire between the U.S. and Iran. The move came after U.S. President Donald Trump confirmed the agreement, contingent on safe passage through the Strait of Hormuz.
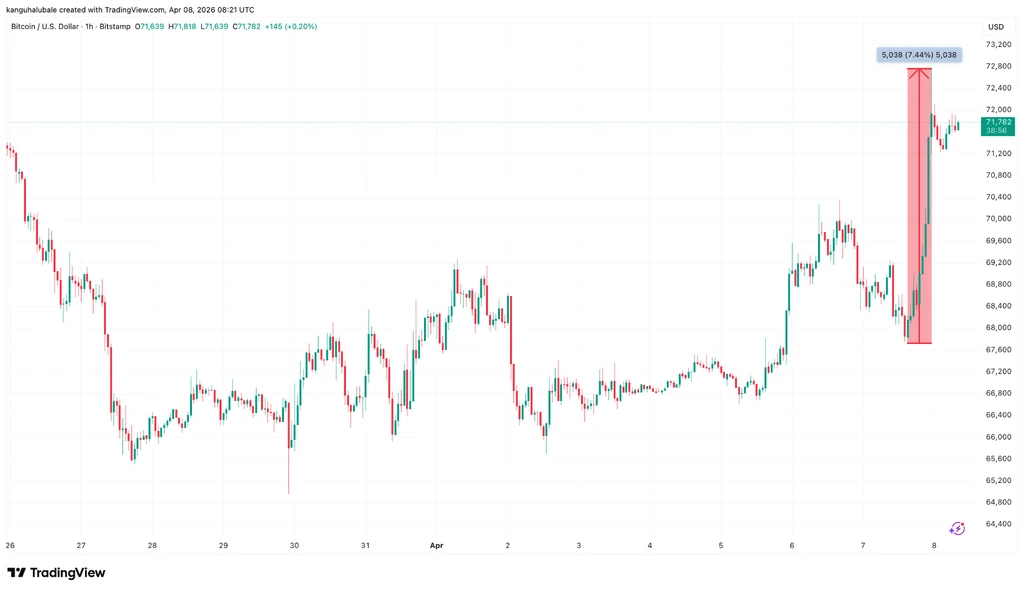
BTC/USD 1-hour chart. Source: TradingView
Traders noted $431 million in short positions were liquidated in 24 hours, with Bitcoin recovering all losses from the past 20 days.
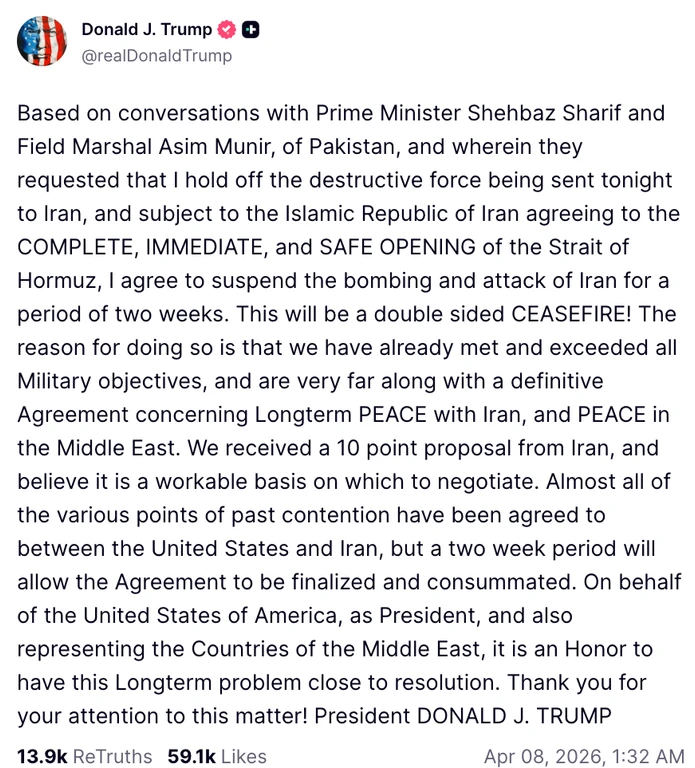
Source: TruthSocial/Donald J. Trump
Oil prices plummeted as much as 16%, dropping below $92 a barrel from a high of $110. Market analysts remain cautious, warning that the rally could be short-lived unless Bitcoin breaks above the $76,000 resistance zone.
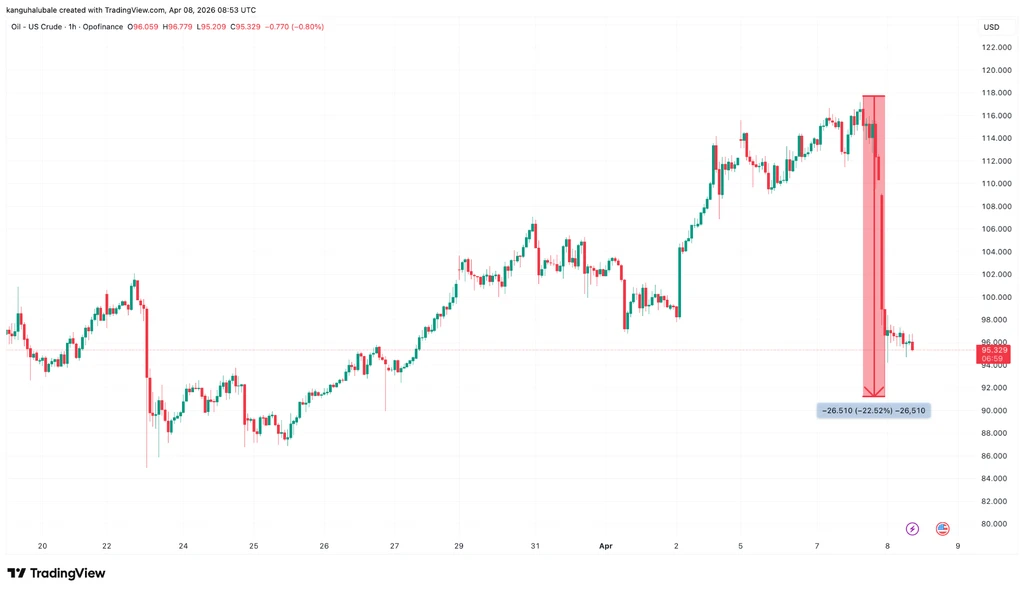
CFDs on WTI crude oil one-hour chart. Source: TradingView
QCP Capital stated that while the geopolitical shift offers hope, infrastructure damage and ongoing diplomatic tests pose risks. Crypto analysts warn that a bearish flag pattern could still emerge if the price fails to maintain momentum beyond $76,000.
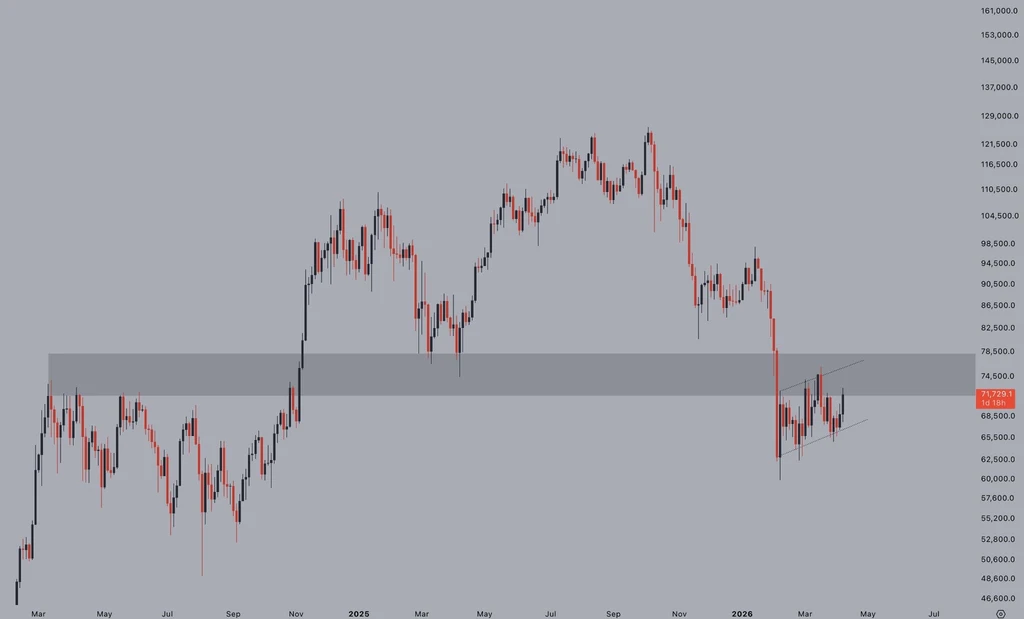
BTC/USD daily chart. Source: X/Jelle
Another analyst emphasized that a close above $76,000 would signal strong bullish potential, possibly pushing Bitcoin toward $86K-$90K. Otherwise, a drop below $60,000 may follow.
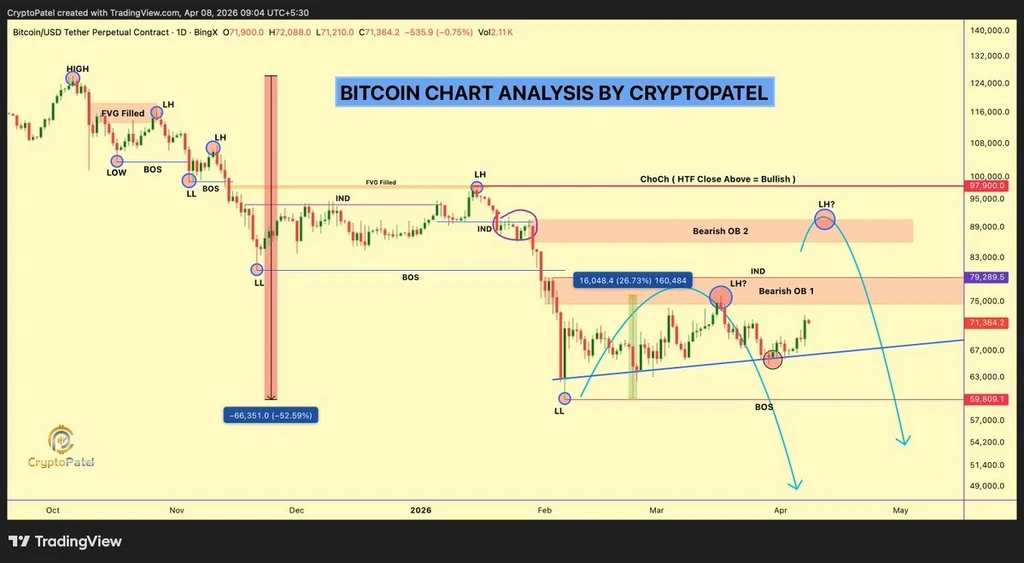
BTC/USD daily chart. Source: X/Crypto Patel
Bitcoin’s near-term direction remains uncertain, with many traders watching for a breakout above the $76,000 level to validate the current rally.