pwshub.com

Bitcoin Poised for a 200% Rally as Analyst Spot Rare Bullish Pattern

Amid Bitcoin’s current gradual recovery in price, attention has been drawn towards the asset as it prepares to be on the verge of closing its seventh consecutive monthly candle above the all-time high (ATH) of 2021.

Renowned crypto analyst Moustache recently took to X to highlight this key milestone, emphasizing the importance of higher timeframes in trading.

According to Moustache, the fact that Bitcoin is holding above its previous ATH every month is a strong indicator of support, which could signal continued upward momentumshortly.

Is Bitcoin Building Momentum For A Big Move?

Mustache’s analysis noted, “Can everyone see what’s happening here? BTC is about to close its SEVENTH monthly candle above the ATH of 2021. The higher the timeframe, the stronger the support. That’s bullish [to be honest].”
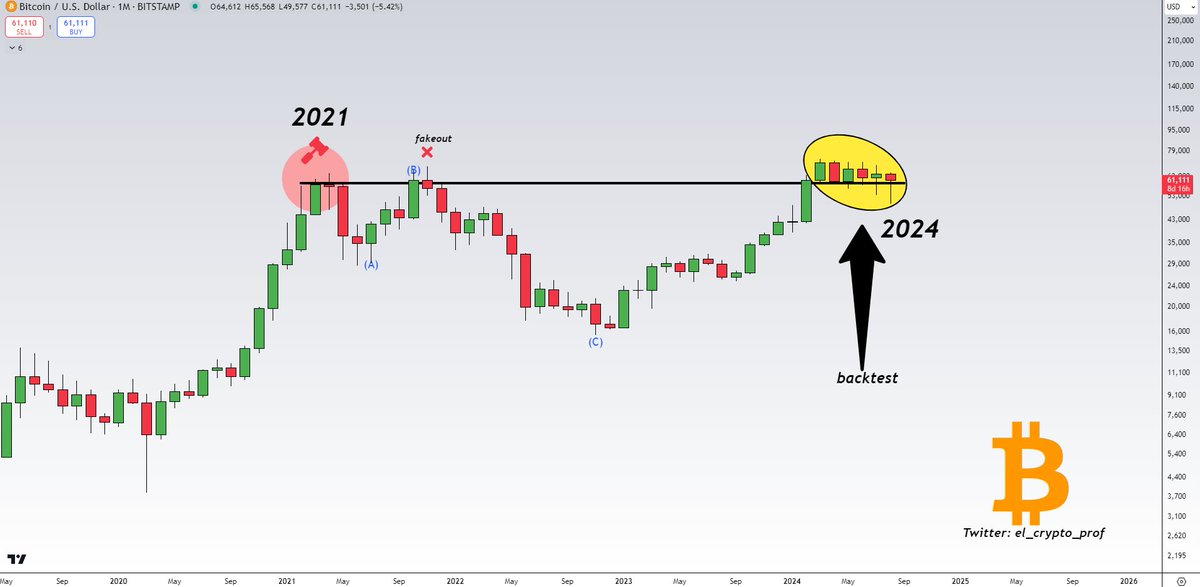
Chart shared by Moustache on X showing Bitcoin about to close above its peak in 2021.
The chart Mustache shared on X shows Bitcoin is about to close above its peak in 2021. Source: Moustache via X

This statement highlights the significance of long-term support levels in his BTC outlook. Notably, in trading, when an asset consistently closes above a previous peak on higher timeframes, it often indicates that the market is forming a solid foundation for future growth.

This observation is particularly relevant for Bitcoin, which has historically exhibited strong price movements following extended periods of consolidation and support-building.

While Bitcoin’s sustained support above its previous ATH is a positive sign, another technical indicator also highlighted by the same analysts: the Bollinger Band Width Percentile (BBWP).

BBWP Indicator Signals 200% Rally Ahead

In a recent post, Moustache pointed out that the BBWP on Bitcoin’s 2-week (2W) chart signals the emergence of blue bars, a rare occurrence only seen once in Bitcoin’s history.
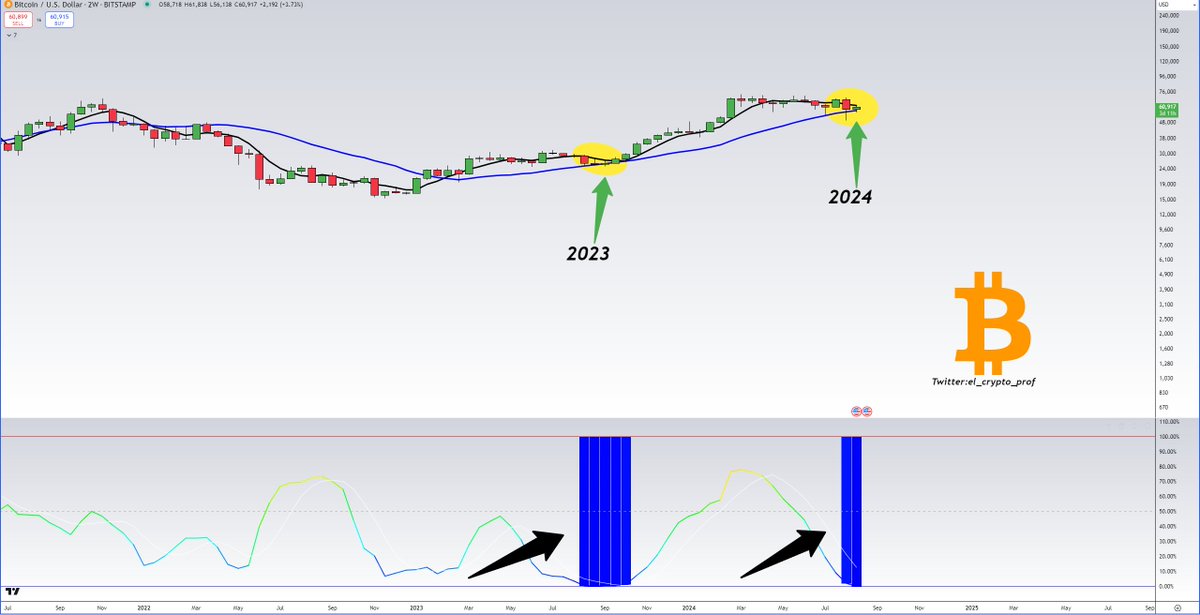
Bitcoin chart shared by Moustache on X showing the blue bar emergence.
The bitcoin chart shared by Moustache on X shows the emergence of the blue bar. Source: Moustache via X

The BBWP is a tool used in technical analysis to measure the width of the Bollinger Bands, which are volatility indicators that reflect the range of an asset’s price movement. The blue bars in the BBWP indicate a period of low volatility, which often precedes significant price swings.

Moustache explained the implications of this signal, disclosing that the last time the BBWP signaled multiple blue bars on the 2W-Chart of BTC, BTC saw almost a 200% upward move.

“Incidentally, this is only the second time we’ve seen blue bars in the BBWP. This has never happened before in history,” Moustache noted. This observation suggests that Bitcoin could be on the cusp of a major price movement, with the potential for significant gains if the historical pattern holds.

Notably, the BBWP’s indication of low volatility aligns with the concept that markets often experience a surge in price action following periods of calm. In Bitcoin’s case, the current environment of subdued volatility, as indicated by the blue bars, may be setting the stage for a significant price breakout.

Bitcoin (BTC) price chart on TradingView.com
BTC price is moving sideways on the 2-hour chart. Source: BTC/USDT on TradingView.com

Featured image created with DALL-E, Chart from TradingView

Source: newsbtc.com

Related stories
2 weeks ago - After briefly trading above $59,000 in the early hours of Tuesday, Bitcoin price has now seen a significant retracement, dropping below the $58,000 price mark once again. However, despite this struggle to rally, a CryptoQuant analyst...
2 weeks ago - Much like Bitcoin, Ethereum has faced significant challenges in recent months, struggling to sustain any major price rally. After reaching a peak of over $4,000 in March, Ethereum has been consistently declining, failing to break out of...
1 day ago - The cryptocurrency market, led by the largest cryptocurrencies Bitcoin (BTC) and Ethereum (ETH), surged on Tuesday to levels not seen in over a month in anticipation of the Federal Reserve’s (Fed) imminent announcement of its first...
4 days ago - An analyst known for making crypto bottom calls thinks that memecoin Pepe (PEPE) and one Solana (SOL) challenger are gearing up for breakout rallies. Pseudonymous analyst Bluntz tells his 273,500 followers on the social media platform X...
1 week ago - A key long-term price indicator for Bitcoin, the 200-day simple moving average (SMA) appears to be losing its bullish momentum as the US economy added fewer jobs in August 2024. Bitcoin Must Overcome The 200-Day SMA To Reverse Trend The...
Other stories
45 minutes ago - Bitcoin price gained pace above the $61,500 resistance. BTC even cleared the $63,300 level and is now consolidating gains above $62,500. Bitcoin is gaining pace above the $62,200 resistance zone. The price is trading above $62,500 and the...
45 minutes ago - In a detailed post on X, crypto analyst Jamie Coutts outlined various indicators he monitors to gauge when the market might pick up bullish momentum. Crypto Market Might Be In The Final Stage Of The Bearish Phase Coutts, Chief Crypto...
1 hour ago - Data shows the cryptocurrency sector as a whole has witnessed a high amount of liquidations following the volatility Bitcoin and others have gone through. Bitcoin Has Recovered Back Above The $63,000 Level Following the news of the US...
2 hours ago - As the broader cryptocurrency market experiences notable gains following the Federal Reserve’s rate cuts, Bitcoin (BTC) has reached a price of $63,670 on Thursday, marking substantial bullish momentum since late August. This surge has...
2 hours ago - Bitcoin's bull pennant suggests a potential surge, with a price target of $158,000 by May 2025 following S&P 500's record high. The post Bitcoin enters ‘bull pennant’ breakout as S&P 500 hits all-time high appeared first on Crypto Briefing.