Assume you’re a product manager of a product with five features. You’ve been asked to find the potentiality of the features based on the customer’s happiness. How would you determine what feature has high potential, what consistently gains customer satisfaction, and what feature customers don’t like?
If you’re sitting here thinking that you don’t know how to proceed, don’t worry! This article teaches you how to calculate variance, as well as the tools and software that you need, and common mistakes to avoid.
What is variance?
Variance is a statistical measure representing the degree or dispersion of a set of data points (participating in the mean calculation) spread out from its mean (average). Simply put, the variance tells you how much each data point deviates from its average value.
Variance is measured in the square of the unit used. The higher the deviation from its mean, the higher the volatility which could interpret instability, unreliability, or inconsistency based on the kind of data and interpretations you are performing.
What is standard deviation (SD)?
Like variance, standard deviation also measures the dispersion of data points from its mean in a given set. But, the key difference lies in the derivation. As you learned above, variance is the squared unit, but the standard deviation is calculated by square rooting the variance.
Take, for example, the age of people in two towns. The variance would give you values in squared years (which isn’t easy to directly interpret), whereas by using the SD you can directly measure the variability in years.
Variance formula
Variance is denoted by symbol 𝛔2:
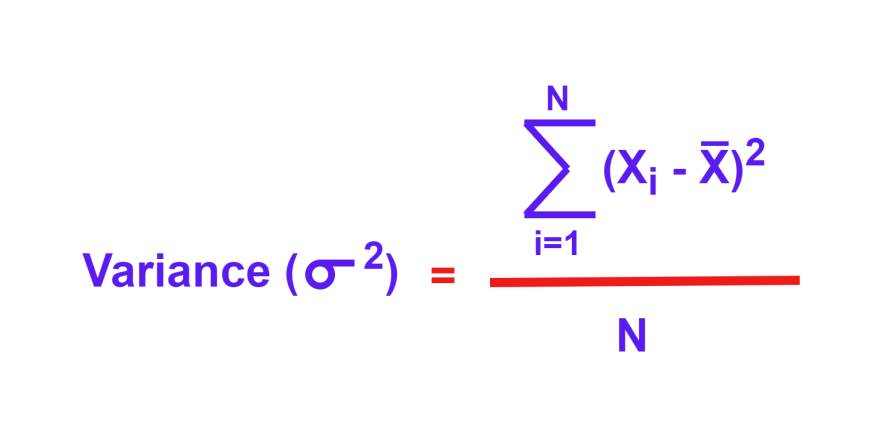
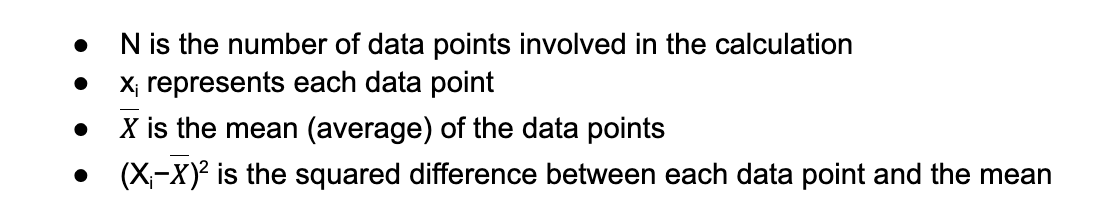
Where:
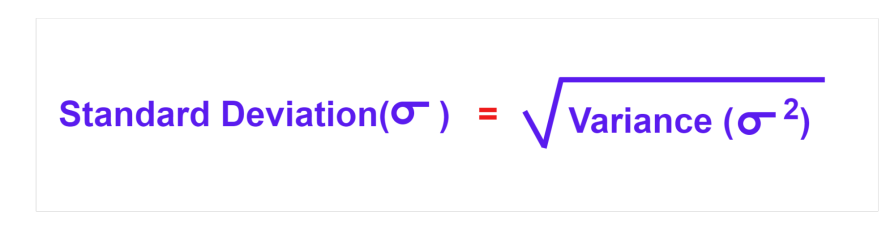
Variance is the key component for calculating standard deviation. SD is denoted by 𝛔 and is the square root of the variance:
Steps to calculate variance and standard deviation
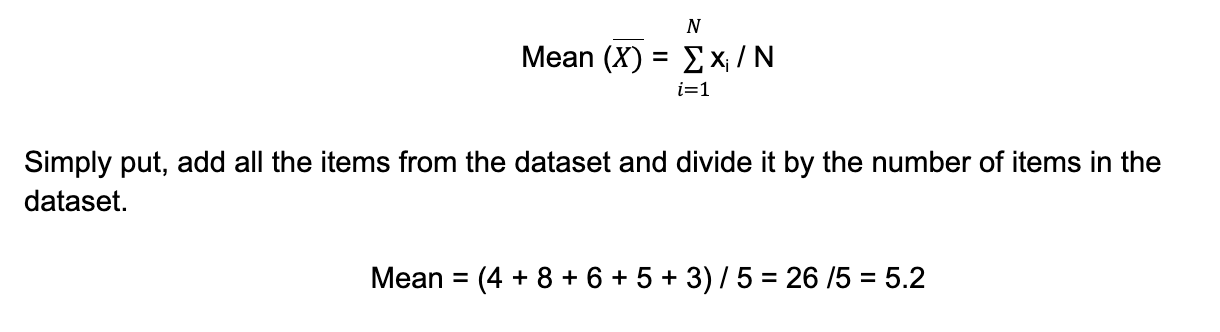
Now, to illustrate how to calculate variance and standard deviation, pay attention to the following example. Assume a data set of {4, 8, 6, 5, 3}:
1. Calculate the mean (average)
2. Subtract each data point from its mean (deviation)
4 − 5.2 = −1.2
8 − 5.2 = 2.8
6 − 5.2 = 0.8
5 − 5.2 = −0.2
3 − 5.2 = −2.2
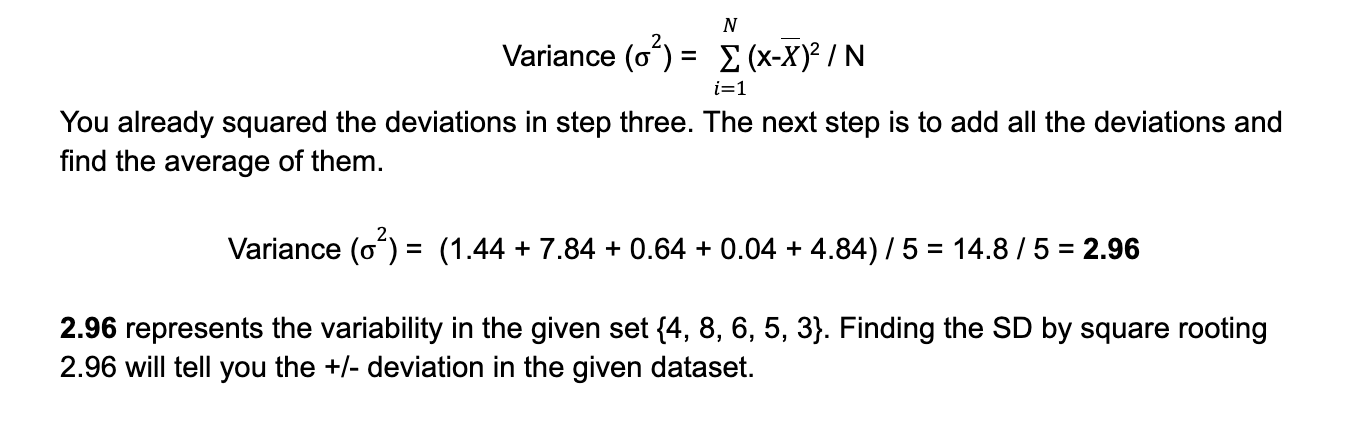
3: Square each deviation
(−1.2)2 = 1.44
(2.8)2 = 7.84
(0.8)2 = 0.64
(−0.2)2 = 0.04
(−2.2)2 = 4.84
4. Apply the formula of variance
Calculating variance case study
Now returning to the opening scenario, imagine you collect CSAT scores (ranging from 1 to 10) for each feature over the last four quarters. One of your customer’s CSAT score sheet looks like:
Feature A — 7, 8, 7, 6
Feature B — 9, 9, 8, 9
Feature C — 5, 7, 6, 5
Feature D — 8, 8, 8, 8
Feature E — 6, 7, 7, 5
To know the potentiality of each feature for this customer, you need to know the volatility in the customer’s satisfaction score. To find this using the above data first, you need to calculate the mean CSAT of each feature:
Feature A — (7+8+7+6) / 4 = 7.0
Feature B — (9+9+8+9) / 4 = 8.75
Feature C — (5+7+6+5) / 4 = 5.75
Feature D — (8+8+8+8) / 4 = 8.0
Feature E — (6+7+7+5) / 4 = 6.25
Using the mean (average) from above, you would then calculate the volatility (variance) of each feature by doing:
Feature A — ((7−7)2 + (8−7)2 + (7-7)2 + (6-7)2) / 4 = 2 / 4 = 0.5
Feature B — ((9−8.75)2 + (9−8.75)2 + (8-8.75)2 + (9-8.75)2) / 4 = 0.75 / 4 = 0.1875
Feature C — ((5−5.75)2 + (7−5.75)2 + (6-5.75)2 + (5-5.75)2) / 4 = 2.75 / 4 = 0.6875
Feature D — ((8−8)2 + (8−8)2 + (8-8)2 + (8-8)2) / 4 = 0 / 4 = 0
Feature E — ((6−6.25)2 + (7−6.25)2 + (7-6.25)2 + (5-6.25)2) / 4 = 2.75 / 4 = 0.6875
However, if you look at feature A, it says that there is a 0.5 variance in customer satisfaction scores with respect to its mean of 7.0. This indicates that the customer happiness rating given by this customer will be closer to the mean.
To find the potentiality, you need an additional step to calculate the standard deviation present in these numbers from the mean. You do this with:
Feature A — Sqrt(0.5) = 0.71
Feature B — Sqrt(0.1875) = 0.43
Feature C — Sqrt(0.6875) = 0.83
Feature D — Sqrt(0) = 0
Feature E — Sqrt(0.6875) = 0.83
How do you interpret this? If you see Feature A, the standard deviation is 0.71, which means, most of the CSAT scores given by users for Feature A would vary between -0.71 to +0.71 from the mean (average). Since the value is low, it shows the customer (users) have a consistent experience from this feature.
Now, looking at the standard deviation of each feature for this one customer, we can conclude that:
- Features A and B show consistent and generally high customer satisfaction, with little variability, suggesting strong and reliable performance. These are potential features to market and gain more customers
- Features C and E have more variability in customer satisfaction, indicating potential inconsistencies in user experience. These features need more evaluation and improvisation to meet customer needs.
- Feature D shows perfect consistency in customer ratings. This feature should be further evaluated based on the usage metrics to understand whether it’s a reliable feature or if customers lack engagement with it
Pros and cons of variance
While variance can be a great tool, it also comes with its fair share of cons. Review the following list to make a more informed decision about its potential adoption:
Pros
- Provides a clear mathematical measure to find how much data is spread out from its mean
- Serves as the basis for other important statistical measures, such as standard deviation, correlation, and regression analysis
- Helps in comparing the variability in different sets of data and understanding the skewness and richness of each set
- Considers all the data points in a set
Cons
- Sensitive to the outliers, which can add inflation to the variance
- Squared units make it less intuitive and difficult to interpret and communicate the conclusions
- Calculation complexity involves various steps to reach the output making it manually cumbersome and expensive
Common mistakes in calculating variance
When calculating variance, make sure to avoid:
- Confusing population with sample variance. The formula changes with the dataset
- Calculating mean incorrectly, omitting any data point, or rounding early
- Forgetting squared units. Misinterpreting data with standard deviation
- Confusing variance with other spread measures like range, interquartile range, or standard deviation
- Considering extreme outliers
Calculating variance manually can be a difficult and time consuming task. To help with this, try automating your process with some of the following tools:
- Microsoft Excel and Google Sheets are popular choices of tools offering built-in functions and macros to help solve variance and build statistical analysis/interpretation on top of it
- Programming languages like R and Python provide math libraries like NumPy helping you to create your program to perform statistical analysis and testing
- Comprehensive statistical software packages such as SPSS, SAS, MATLAB, STATA for advanced variance analysis
Final thoughts
Variance is a fundamental statistical measure that quantifies the spread or dispersion of data points within a dataset. Understanding variance is crucial for analyzing data, assessing risk, and making informed decisions in product management.
By accurately calculating and interpreting variance, you can gain deeper insights into data patterns, identify areas for improvement, and make more informed decisions. Good luck with your calculations and be sure to comment with any questions!
Featured image source: IconScout