A Bitcoin bottom signal, previously seen before a 130% rally, has re-emerged, sparking speculation about a potential bullish turnaround. However, the current market landscape, characterized by shifts in liquidity, exchange-traded fund (ETF) flows, and macroeconomic data, presents a different environment than in past cycles.
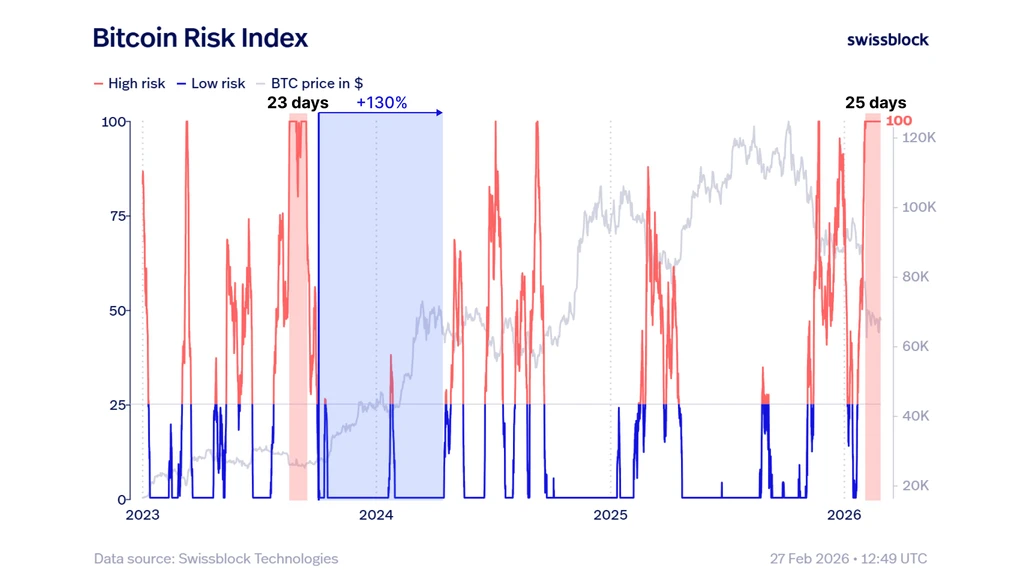
Bitcoin has now spent 25 consecutive days in its “extreme high risk” zone, a record duration. Historically, prolonged stays in this zone have preceded bottoms. Data also shows Bitcoin’s price interacting with levels that previously marked bottoming phases, mirroring patterns seen in 2023 when a shift to lower risk coincided with a strong bullish expansion.
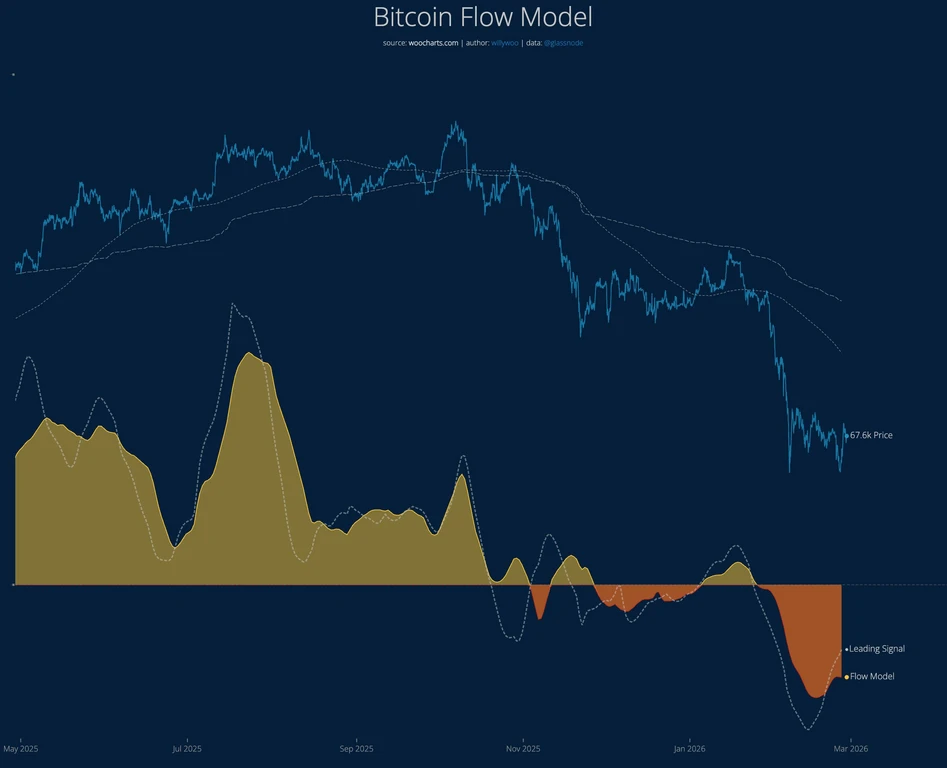
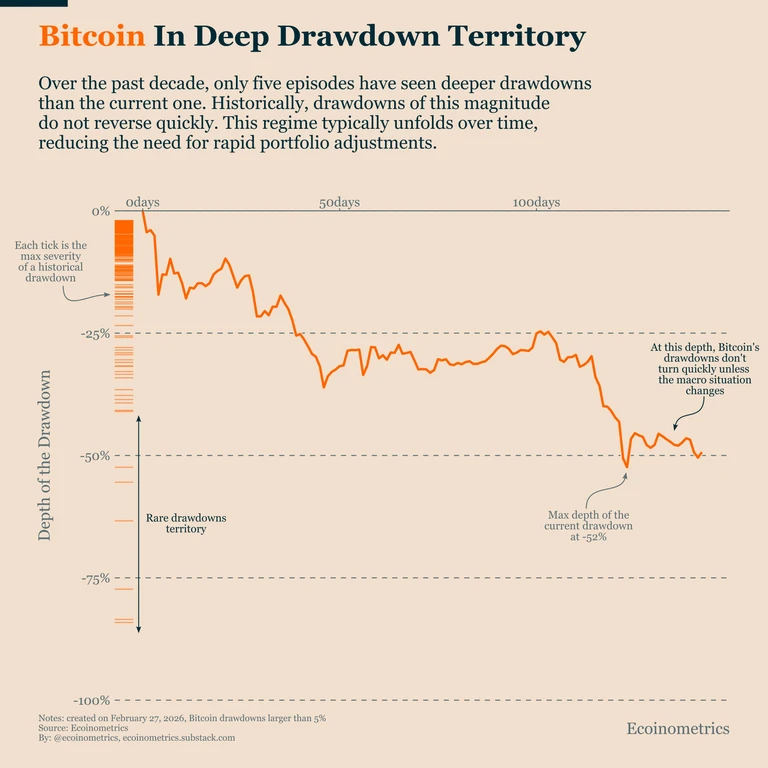
Despite these signals, trader positioning does not yet reflect an uptrend, with demand fluctuating. Analysts note that Bitcoin drawdowns of this magnitude rarely resolve quickly, with recoveries typically taking extended periods, excluding the unique conditions of the 2020 rally. Cumulative inflows into gold ETFs have recently surpassed spot Bitcoin ETF flows, and Bitcoin funds have experienced negative flows on a 90-day rolling average.
Inflation trends add to the cautious outlook, with key indicators remaining above Federal Reserve targets, limiting expectations for liquidity expansion. Experts suggest that any short-term rallies may face selling pressure, with significant price levels around $45,000, $30,000, and $16,000 representing historical support zones.