
Ethereum has flashed a Tom Demark (TD) Sequential sell signal on its weekly chart, a pattern that previously preceded a 63% price drop.
The indicator, used to spot trend reversals, has completed a nine-candle setup, suggesting the current bullish trend may be exhausted.
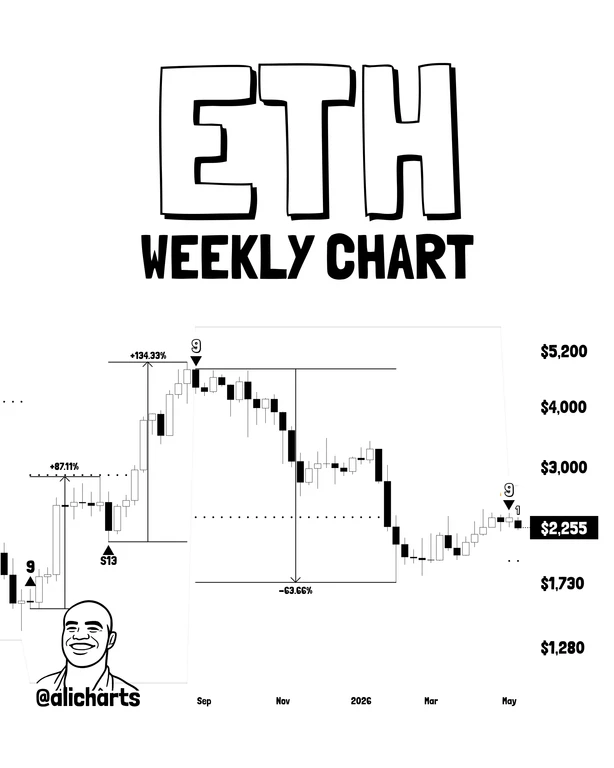
Analyst Ali Martinez notes the TD Sequential has been reliable for ETH over the past year. April and June buy signals led to surges of 86% and 134%, while an August sell signal resulted in a 63% decline.
According to Martinez, "This suggests Ethereum is entering another corrective phase." He has set three price targets: $1,900 short-term, $1,595 mid-term, and $1,090 long-term.
The long-term target aligns with the lower boundary of a Parallel Channel on the weekly chart, a key support level.
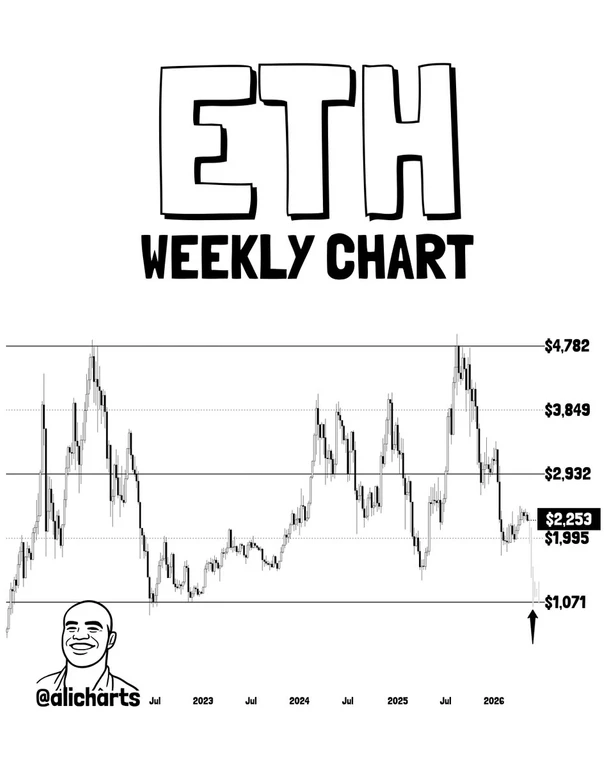
Martinez says, "$1,071, at the bottom of the channel, looks like a strong area to buy Ethereum."
Ethereum currently trades around $2,220, down this week.