
XRP tumbled nearly 30% in 2026, hitting a key psychological level below $1. A symmetrical triangle pattern on the daily chart points to downside targets at $1.14 and $0.88.
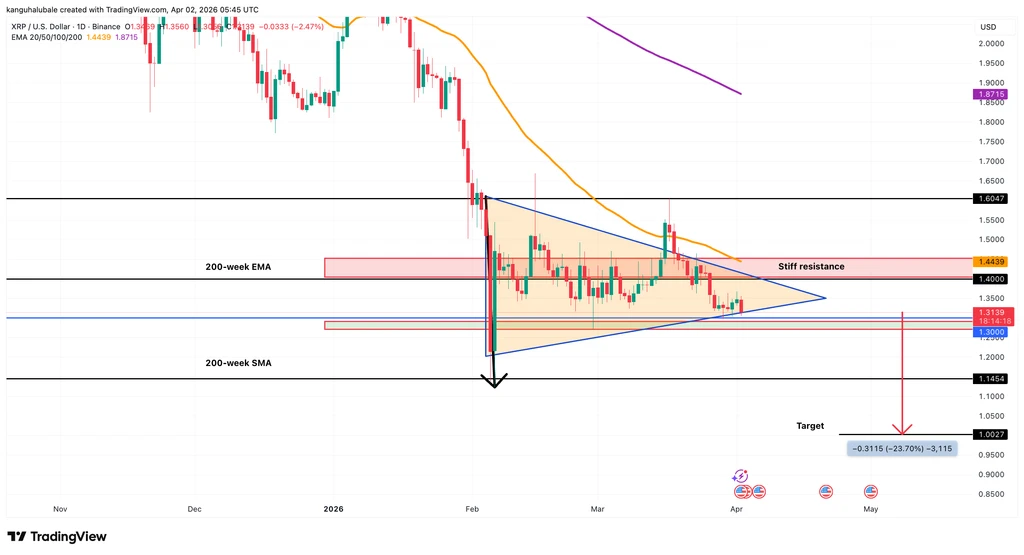
XRP/USD daily chart. Source: Cointelegraph/TradingView
The $1.40-$1.45 supply zone, where over 1.1 billion XRP was previously acquired, now acts as resistance. Analysts at CryptoBasic warn that a breach below $1.30 confirms the downtrend.
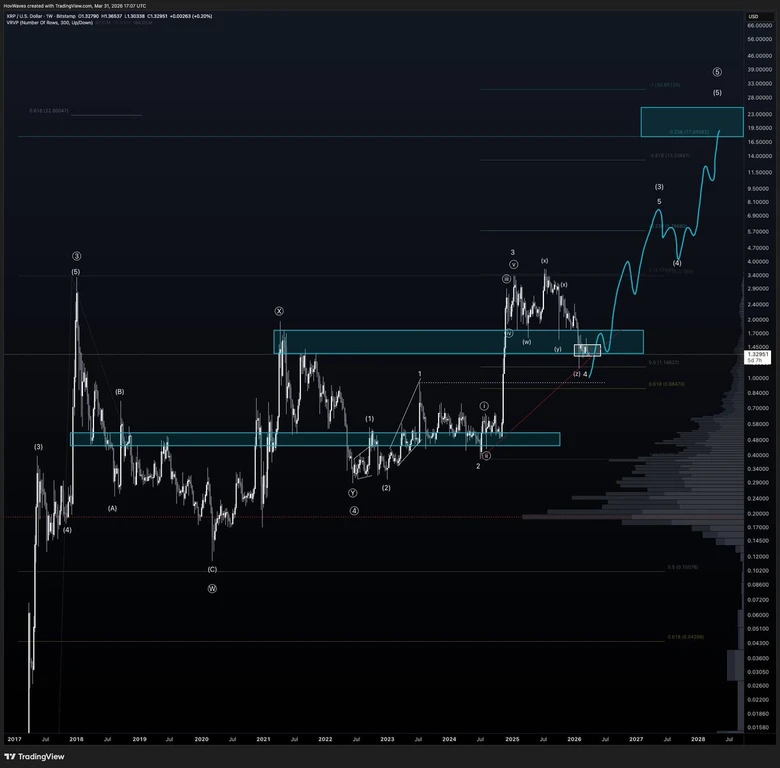
XRP/USD weekly chart. Source: X/TheCryptoBasic
On-chain metrics show a sharp drop in daily active addresses, now hovering around 50,000-far below levels seen earlier in 2025. Transaction counts also fell 44% to 1.5 million.
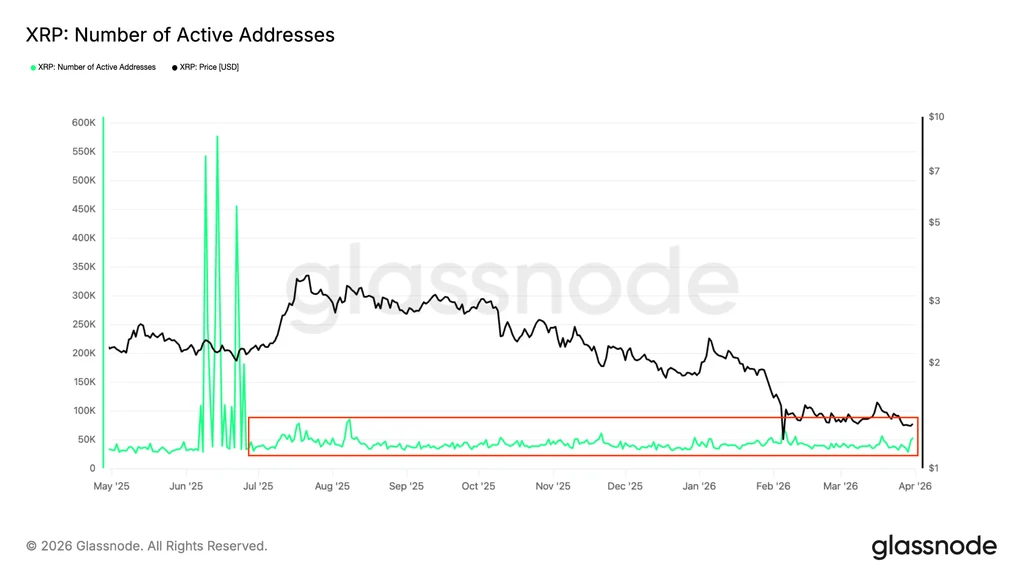
XRP Daily Active Addresses. Source: Glassnode
US-based spot XRP ETFs have posted net outflows since March, reflecting weakening institutional demand. Assets under management declined from $1.24 billion to $947 million.
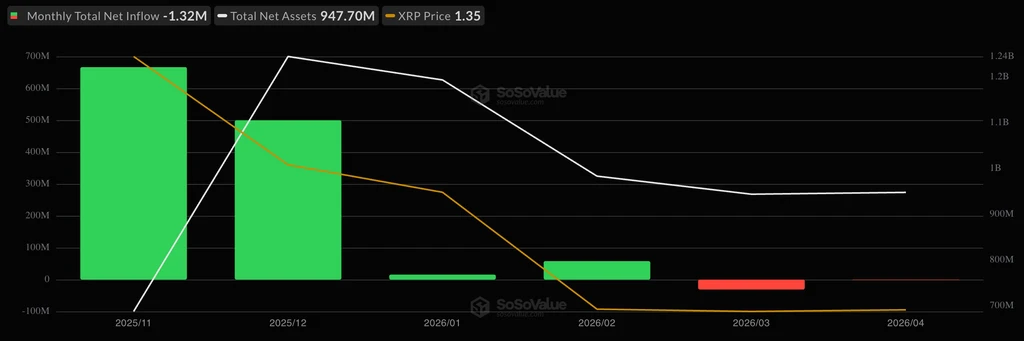
Spot XRP ETF flows chart. Source: SoSoValue
Despite a strong initial rally, XRP's fundamental indicators now suggest a bearish outlook for the near term.