Prioritizing or narrowing down possibilities can be time-consuming. This not only fosters stress and anxiety, but brings productivity and morale to a standstill. However, it doesn’t have to. With the right processes in place, you can make more effective decisions to ensure future success.

The 2×2 matrix stands out for its ability to help you through scenarios where your possible outcomes depend upon two factors. Keep reading to learn more about how you can create and use a 2×2 matrix within your product team.
What is a 2×2 matrix?
A 2×2 matrix is a visualization that enables you to prioritize or narrow down any number of possibilities by sorting them into one of four categories based on two key factors.
To start, you simply need to gather the possibilities that you’re trying to prioritize or narrow down, determine the two key factors that said possibilities depend on (e.g., impact and effort), and then spend just a few seconds of your time creating a blank 2×2 matrix:

Benefits of utilizing a 2×2 matrix
A 2×2 matrix helps you prioritize and make decisions with speed and clarity. The structure mitigates the potential for biases and fallacies by providing a clear visualization as to why certain ideas were chosen.
You can also use 2×2 matrices to simplify how you’re going to evaluate possibilities. For example, sometimes you need to evaluate a product or feature on the basis of cost and complexity, not cost, complexity, impact, timing, and so on.
Types of 2×2 matrices
2×2 matrices can be used in various scenarios. Depending on the scenario, your 2×2 matrix might even have a more specific name. These include:
Impact-effort matrix
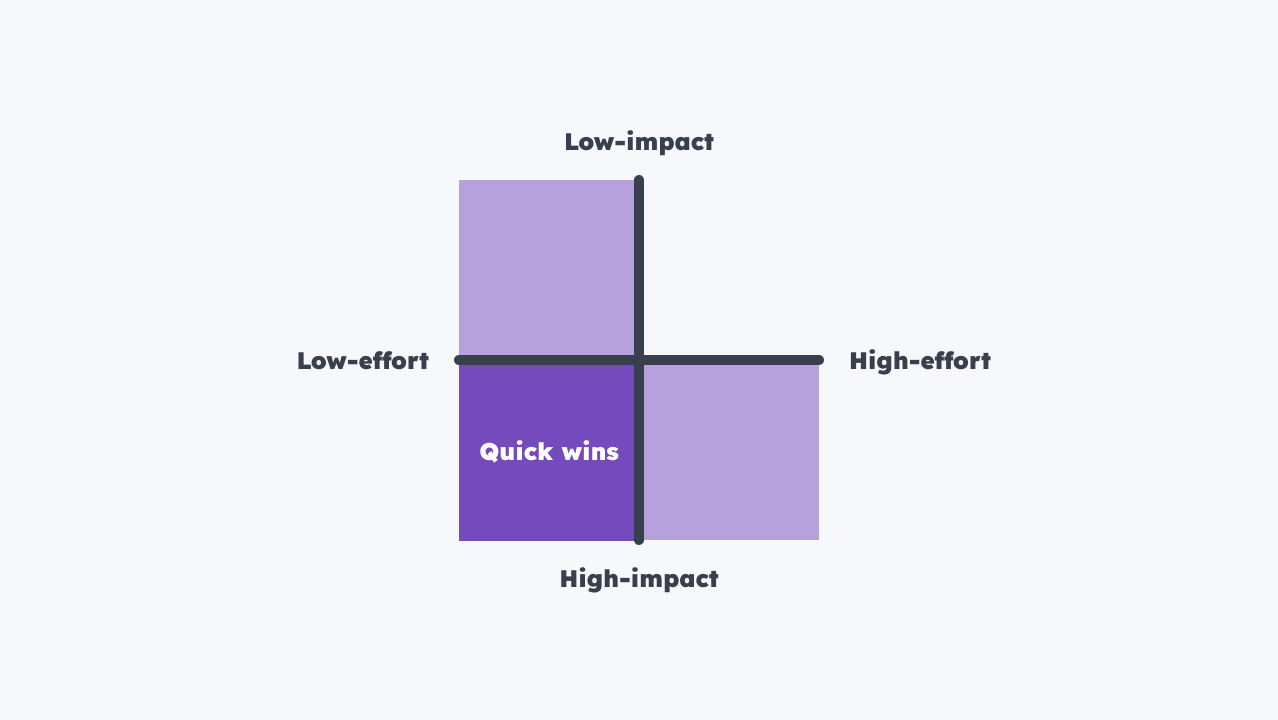
The impact-effort matrix is a type of matrix that you’ve probably heard of already. It’s so popular that it’s sometimes referred to as a prioritization matrix, even though plenty of matrices can be used for prioritization. You normally use an impact-effort matrix to narrow down “quick wins.”
You might also use an impact-effort matrix to investigate underperforming business objectives, since these quick wins can really turn things around at a crucial time. If you’re a football fan, I like to think of these outcomes as the last-minute equalizer:
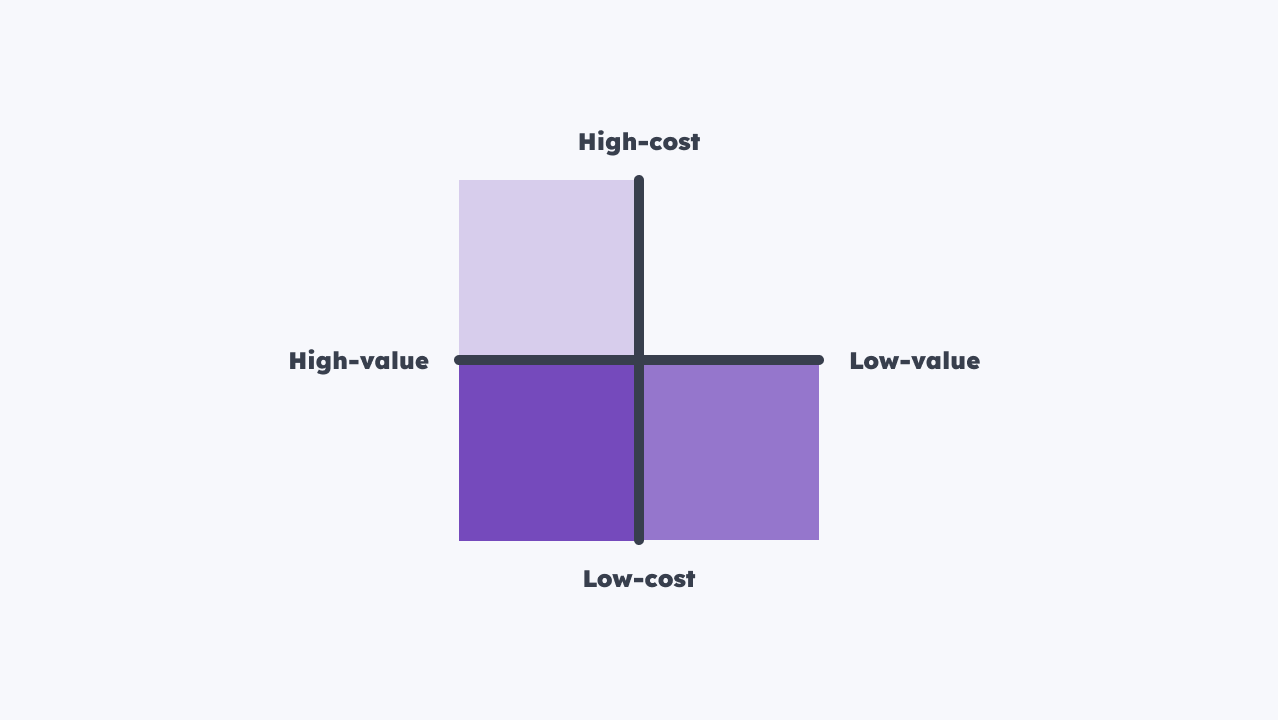
Cost-value matrix
Simply put, a cost-value matrix helps product teams estimate which opportunities might have the highest return-on-investment (ROI). Budgets tend to be the largest constraint for product teams, so this one is pretty common too. That being said, if you’re dealing with a low budget then it should play a significant role in your prioritization process:
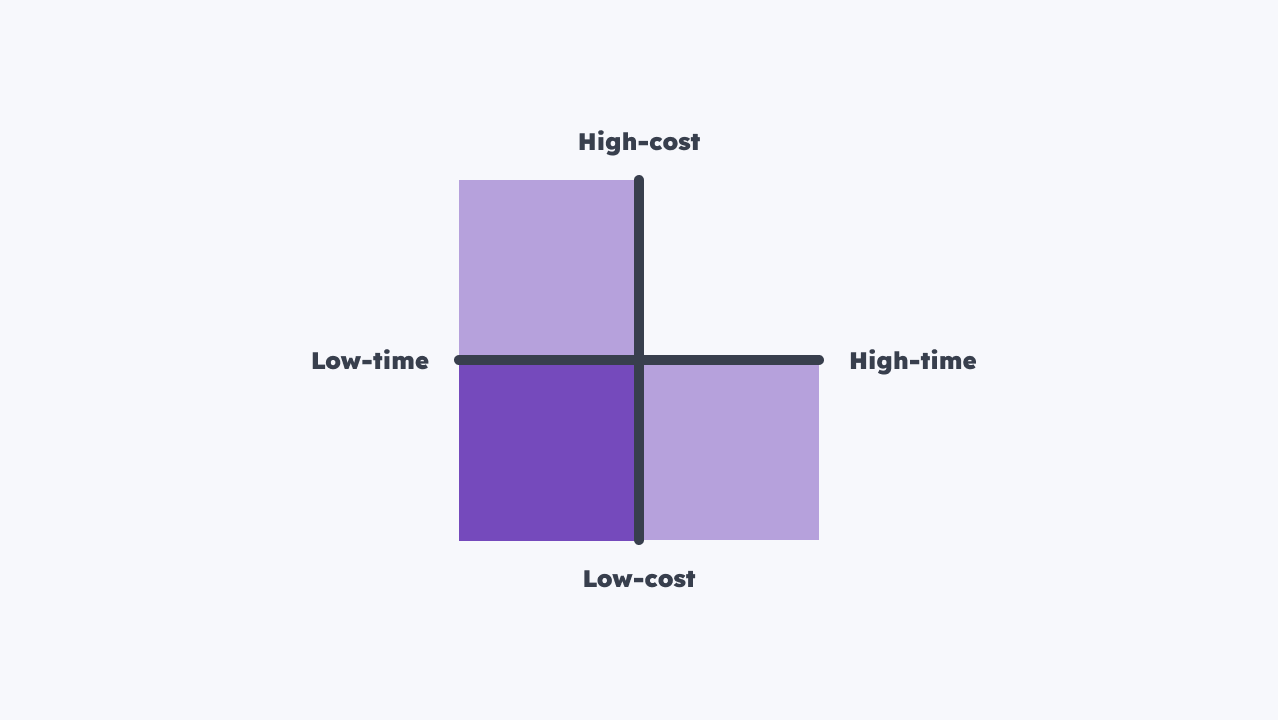
Cost-time matrix
When creating a product roadmap, I recommend including stretch goals. These are additional to-dos from your product backlog that you can try to complete if you accomplish everything you need for the quarter.
By using a cost-time matrix to determine which of these to-dos to check off, you can significantly reduce your product backlog. If nothing else, you can relieve anxiety and boost morale:
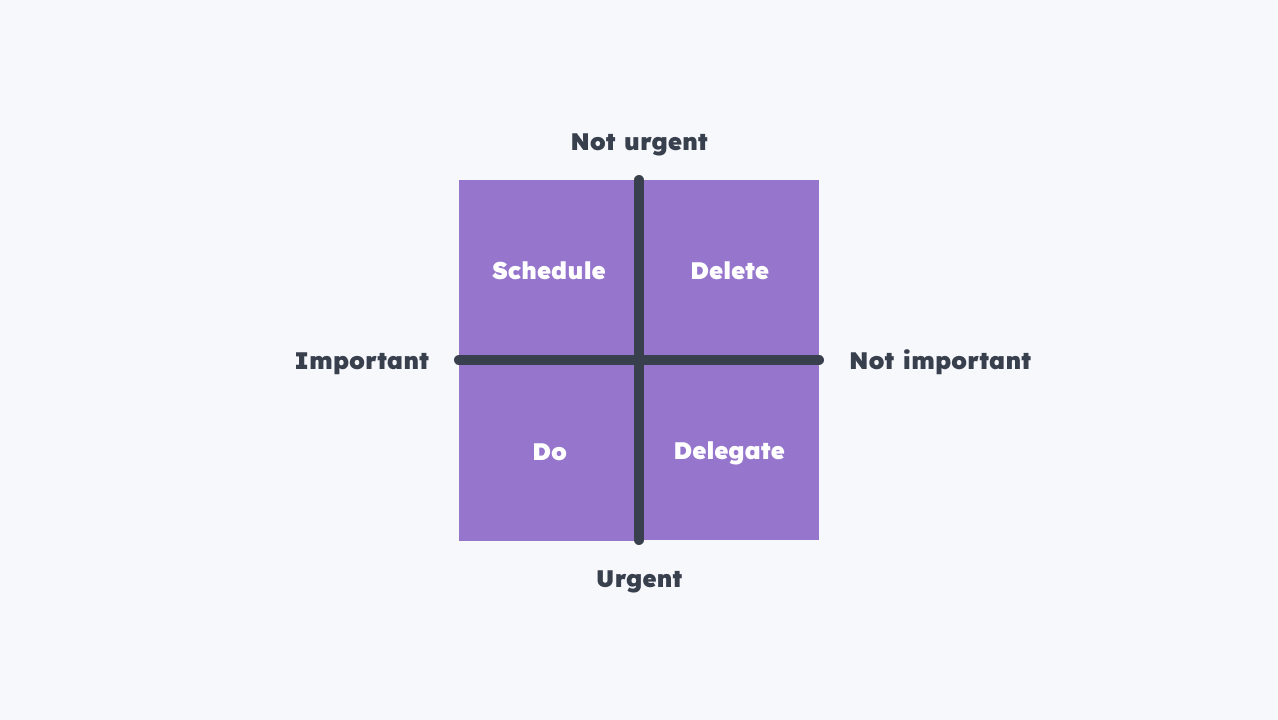
Urgent-important matrix
In times of high stress, people can mistake urgency for importance. A lack of bandwidth leads to people not taking the time to think and communicate properly. Sometimes referred to as the Eisenhower matrix, the urgent-important matrix can help product teams separate what’s urgent from what’s actually important.
Specifically, the to-dos are sorted into one of four quadrants: do (important and urgent), schedule for later (important but not urgent), delegate (urgent but not important), or delete (neither important or urgent). This prioritization matrix allows for the deletion of to-dos, although it’s more applicable to project management than product management:
How to create a 2×2 matrix
You can easily create a 2×2 matrix with the right process and tools. To help with this, try the following:
Process
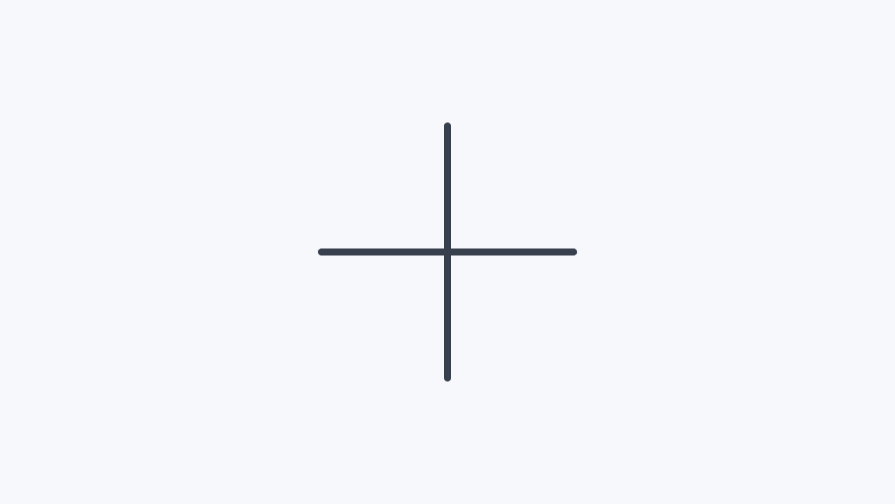
As you’re probably aware by now, to create a 2×2 matrix you’d need to draw a cross that results in four quadrants:
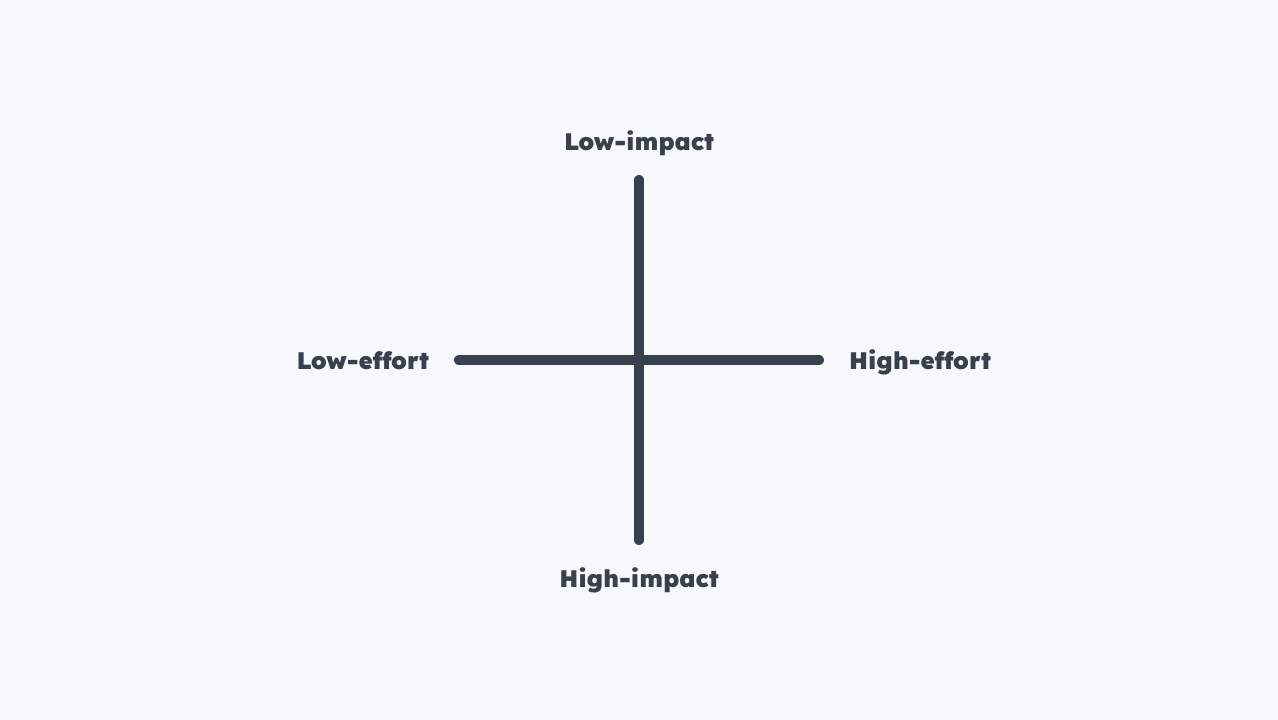
Next, label each of the four cross points according to the two factors the possibilities will be qualified against. For example, if you were creating an impact-effort matrix, the four cross-point labels would be:
- Low-impact
- High-impact (on the cross point opposite low-impact)
- Low-effort
- High-effort (on the cross point opposite low-effort)
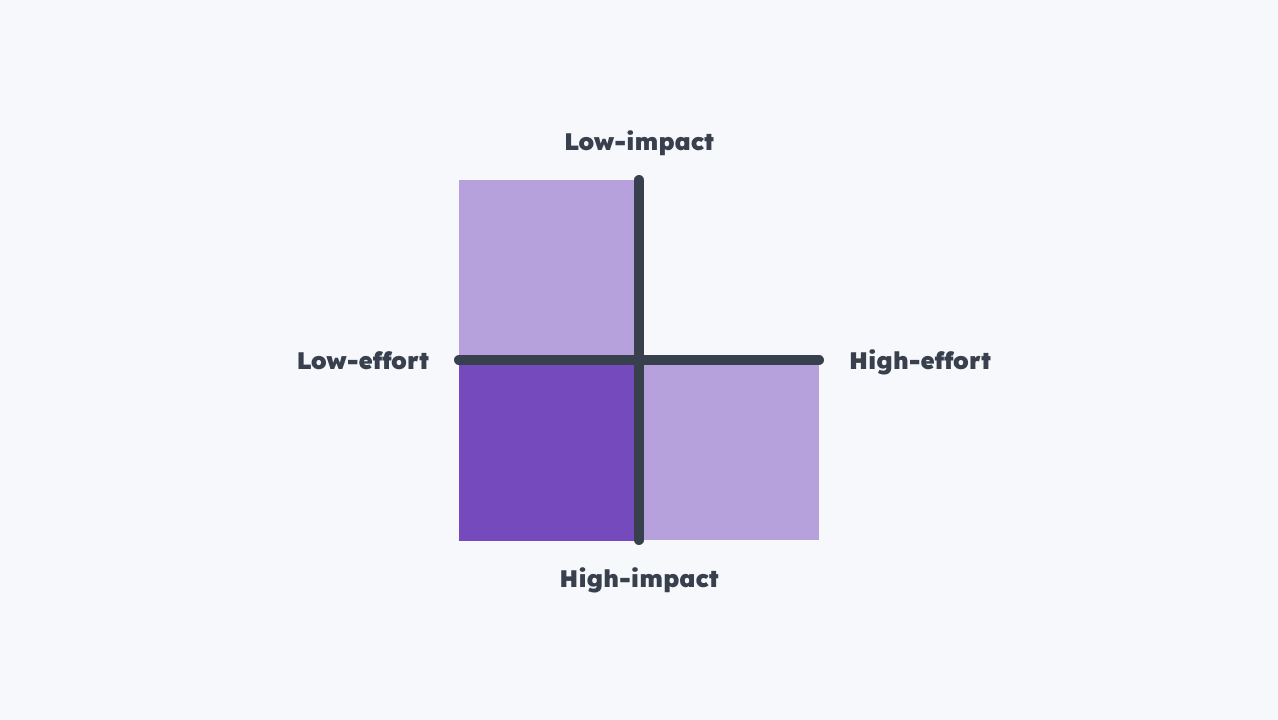
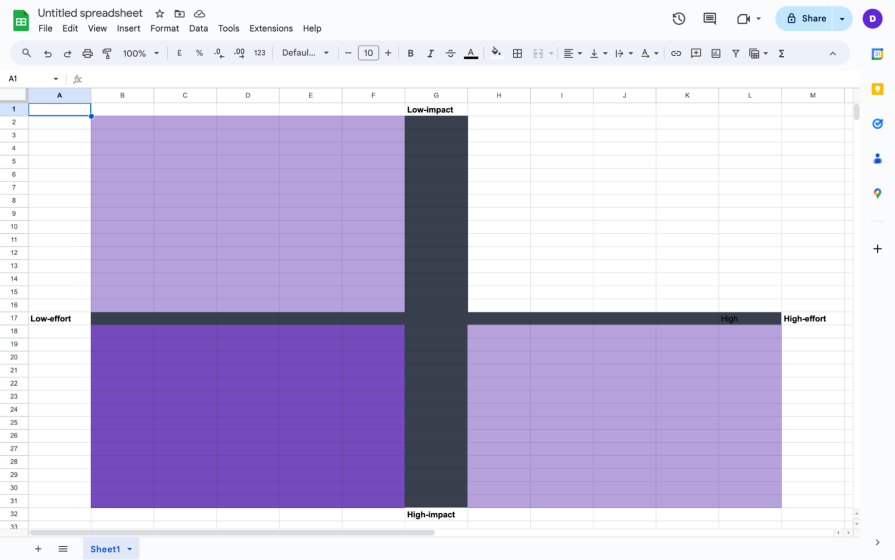
After that, I recommend color-coding the quadrants so it’s clear how “good” each one is. However, to make your 2×2 matrix accessible to people with color vision deficiencies (CVDs), alter the opacity of a single color rather than using four different colors. Specifically, the best quadrant (“high-impact/low-effort” in this case) should have 100 percent opacity and the good-but-not-the-best quadrants should have 50 percent opacity.
Thanks to the color coding, if you’re looking for the best possibilities, you know to avert your eyes to the darkest quadrant. Similarly, if you’re looking for the possibilities that you should prioritize first, you know to avert your eyes to the darkest quadrant or the 50 percent-opacity quadrants if that one is empty. In any case you don’t need to read the labels and think about what each quadrant really means:
As an added bonus, you could alter the opacity of the 50 percent-opacity quadrants if one of the factors is more important than the other.
Tools
You can easily just create 2×2 matrices by using pen and paper:

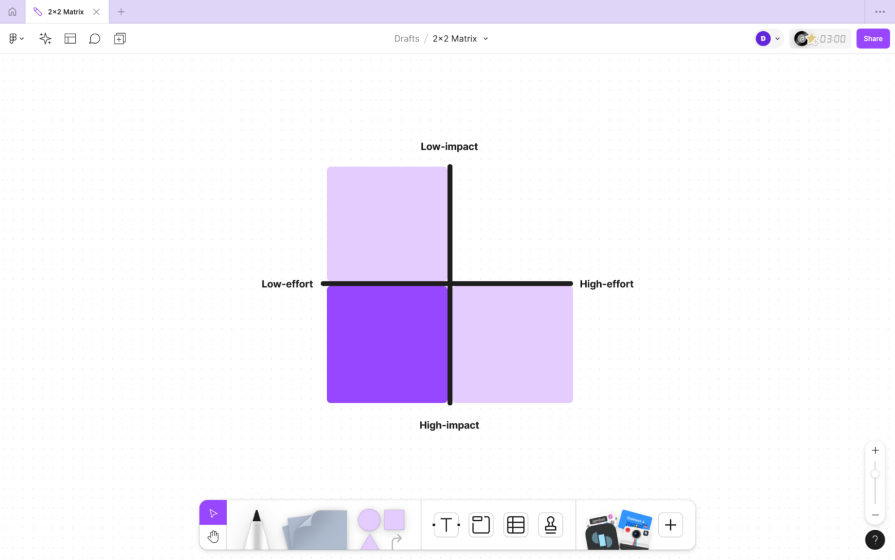
However, if you’re collaborating remotely and/or you need to store your 2×2 matrix digitally, then a whiteboarding tool such as FigJam or Miro might be better:
2×2 matrices are so simple that you could probably create one using almost any tool. For example, if you’re partial to spreadsheets, there’s no reason why you couldn’t create a 2×2 matrix in Google Sheets:
prioritization
Either way, remember to save your blank 2×2 matrix as a template so that you can reuse it.
Final thoughts
2×2 matrices are great for prioritization and narrowing down possibilities. You could create a 2×2 matrix using something as simple as pen and paper and have your possibilities sorted into the quadrants in a matter of minutes.
Plus, thanks to the tools available (namely, whiteboarding tools), you can create, store, and synchronously or asynchronously collaborate on 2×2 matrices.
If you have any questions, ask them in the comment section below.
Thanks for reading!
Featured image source: IconScout