
Bitcoin is on track for its fifth consecutive red monthly candle, a rare occurrence not witnessed since 2018. The cryptocurrency is down approximately 15% this month, following four prior months of decline. Historically, such prolonged selloffs have sometimes preceded significant rebounds, though these reversals are not guaranteed.
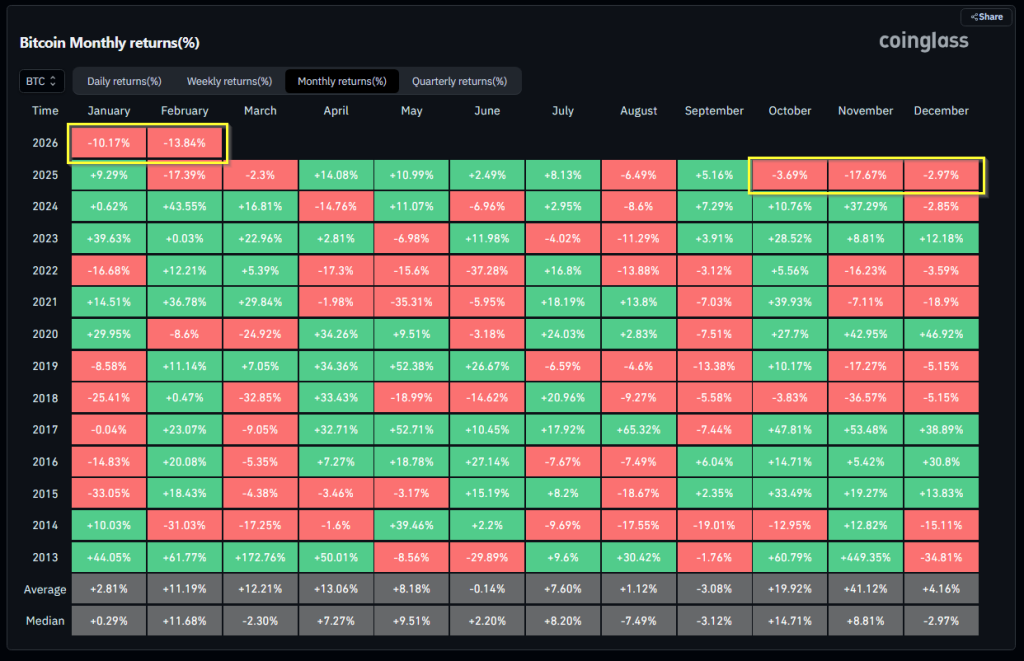
While some analysts point to historical precedents, like the rebound following the 2018/19 losing streak which yielded substantial gains, context is crucial. Market cycles are complex, and simple percentage comparisons can overlook critical differences in liquidity, participant composition, and macroeconomic conditions.
Weekly charts are flashing cautionary signals, with some analysts noting a pattern of red weekly candles reminiscent of 2022. During that period, extended selling pushed Bitcoin to the mid-$20,000s. Quarterly data from the 2022 downturn also illustrates that losses can persist for extended periods, impacting holders who anticipated swift recoveries.
Some market observers suggest the current cycle differs, as the monthly Relative Strength Index (RSI) has not shown the same overbought expansion seen before previous bear phases. This perspective implies that potential rebounds may not follow established historical patterns.
Bitcoin's price action has been characterized by volatile swings on headlines, thin trading sessions, and muted volume between movements. Market behavior has varied, showing fragility at times and steadiness at others, influenced by trading participants and liquidity dynamics.
Geopolitical events and policy shifts are increasingly acting as volatility amplifiers, with traders more readily factoring in headline risk. US policy changes and significant political statements are being closely monitored for their potential impact on dollar flows and investor risk appetite. In thin market conditions, minor news can trigger substantial price movements, a trend observed recently.