
Bitcoin price fell below $68,000, continuing its decline from recent highs above $71,200. The asset now trades below the 100-hour simple moving average and faces resistance at $67,250 on the hourly chart.
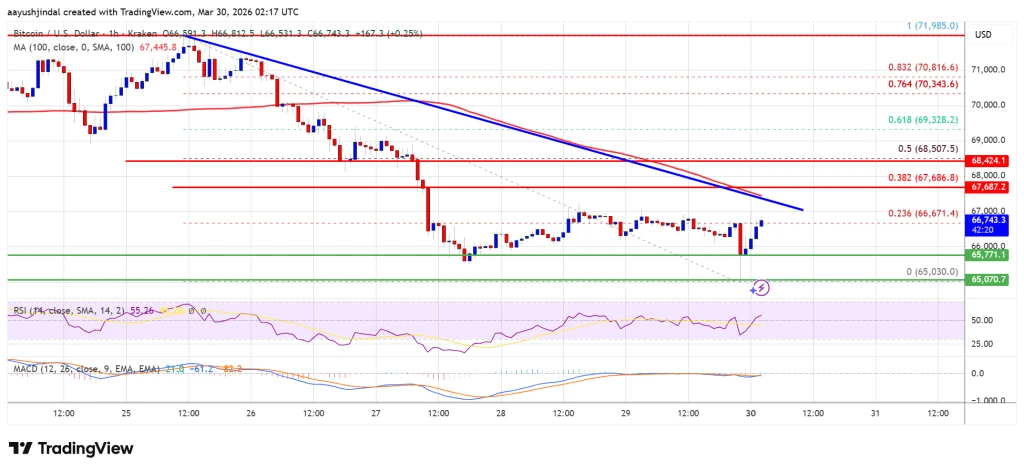
The price recently tested the $65,000 support zone after forming a low at $65,030. If BTC holds above $65,750, a rally toward $68,500 or the 50% Fibonacci retracement may be possible. However, a break below $65,000 could push the price toward $64,000.
Technical indicators show a weakening bullish momentum, with MACD in a bearish zone and RSI hovering around 50. Key resistance levels include $67,250 and $68,500, while major supports are at $65,750, $65,000, and $64,200.
The next move will likely depend on whether the price can hold above $65,750 or falls deeper into the $64,000 zone.