
Ethereum's price has surged 18% since dipping below $1,800 on February 6th, successfully reclaiming the $2,000 support level. This recovery is underpinned by a significant spike in price volatility and a low MVRV Z-score, both signaling a potential local bottom.
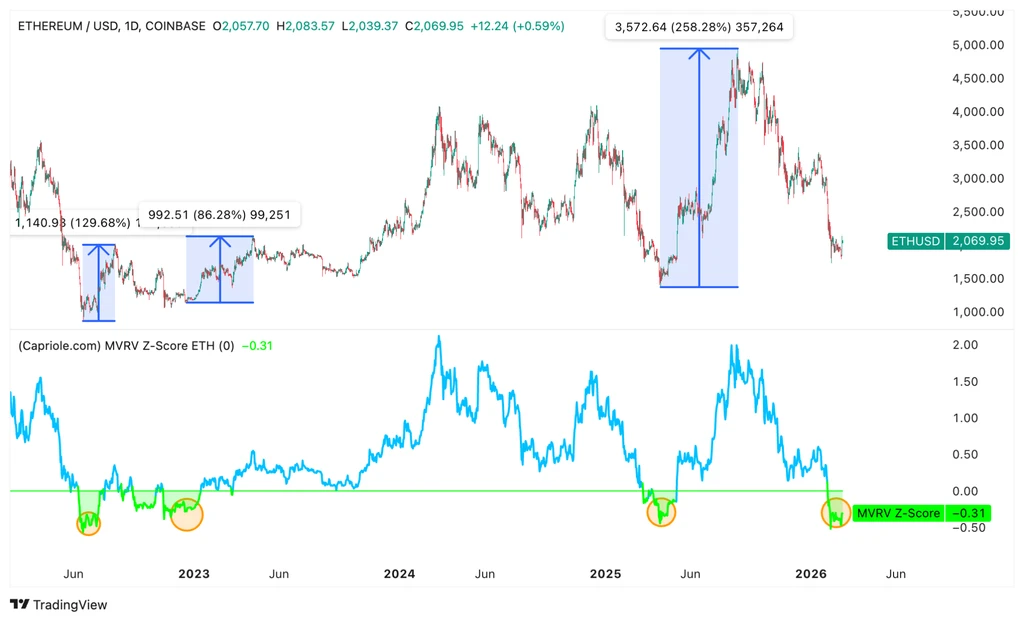
Realized volatility for Ethereum on Binance has reached its highest point since March 2025, a key indicator of impending price action. Concurrently, Ether's MVRV Z-Score has fallen into the historical accumulation zone, further strengthening the case for a bottom formation.
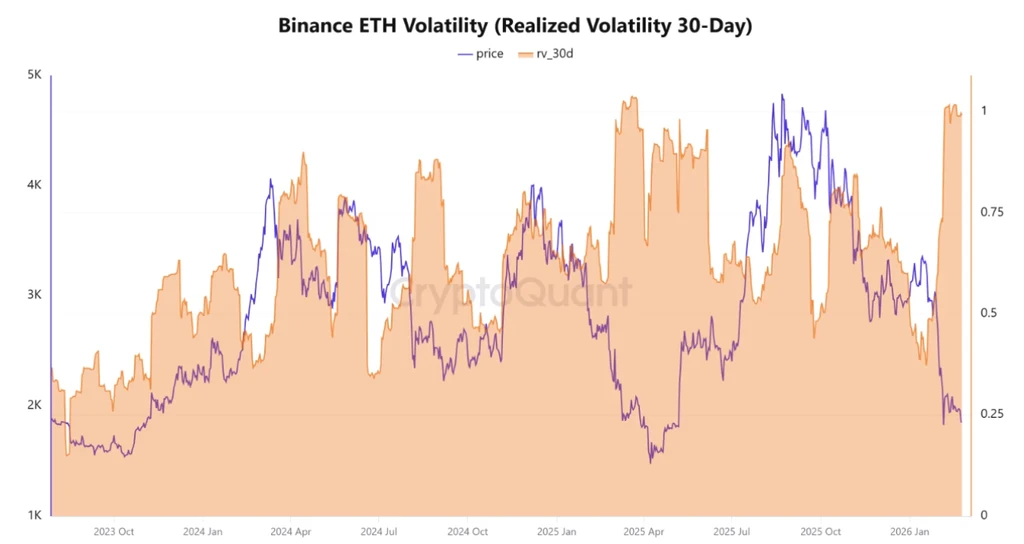
The recent surge in volatility mirrors patterns observed in late March/early April 2025 and Q4 2024, each preceding substantial price rallies for ETH. If historical trends hold, this volatility spike may signal the end of the current downtrend, paving the way for a multi-month recovery.
Furthermore, Ether's MVRV Z-Score, a critical on-chain metric, has entered the accumulation zone, suggesting the cryptocurrency is oversold. This metric previously indicated bottoms in April 2025, following significant price drawdowns, and preceded considerable rallies.
Technical analysis also reveals that Ethereum's current price structure closely resembles the pattern that fueled its 2020-2021 rally. The asset is holding a multi-year trend line around the $1,800-$1,900 support zone, a level that has historically preceded parabolic price increases.
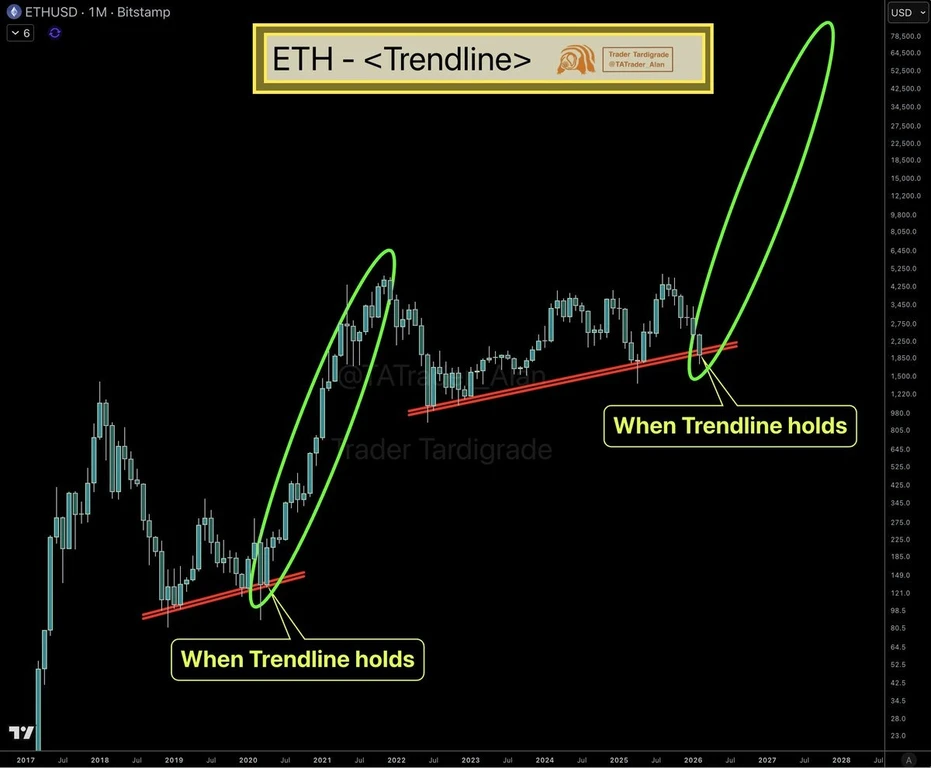
This ascending support trend line, tested again by current price action, suggests a potential for another significant upward move if it holds. Investors have actively accumulated ETH within this $1,800-$1,900 range, reinforcing its significance as a support zone.